Data source configuration
Qbo allows users to have conversational access to data in a relational database without needing to know SQL. Qbo has a unique process for understanding the contents of a database, deciding the kinds of queries that can be asked, exposing the possible queries to the end-user through auto-completions and auto-suggestions, and training natural language processing to understand users’ utterances in the context of the data present in the database. Most of this process is automated, but it still benefits from information and hints about the data model from a developer or data architect.
Qbo supports a wide variety of queries on relational databases utilizing all common SQL constructs, including SELECT, WHERE, GROUP BY, ORDER BY, LIMIT, JOIN, AND, OR, NOT, LIKE, HAVING, and UNION. It supports date related functions, nested queries, queries involving multiple clauses, binning, and aggregation functions. It can query multiple table types, including fact tables, dimension tables, junction tables, and star and snowflake schemas.
You can hook up multiple data sources to Qbo. For example, it can connect to the sales database on MariaDB and the inventory database on Oracle. When a user asks a question, Qbo can convert it to a query and route it to the appropriate database to fetch the results.
Unsupported
Qbo does not support:
Multiple data sources that have the same entity names.
Queries that span multiple data sources. If you need to query across data sources, we recommend using technologies like Apache Presto.
This section will take you through the configuration steps you need to add a new data source, select the tables that will be used by the QueryBot, and configure the data model and analytics against the selected tables.
New data source
To add a new data source, browse to Settings > Data Sources and click the Add a new data source card.
Related Videos
Add a new data source
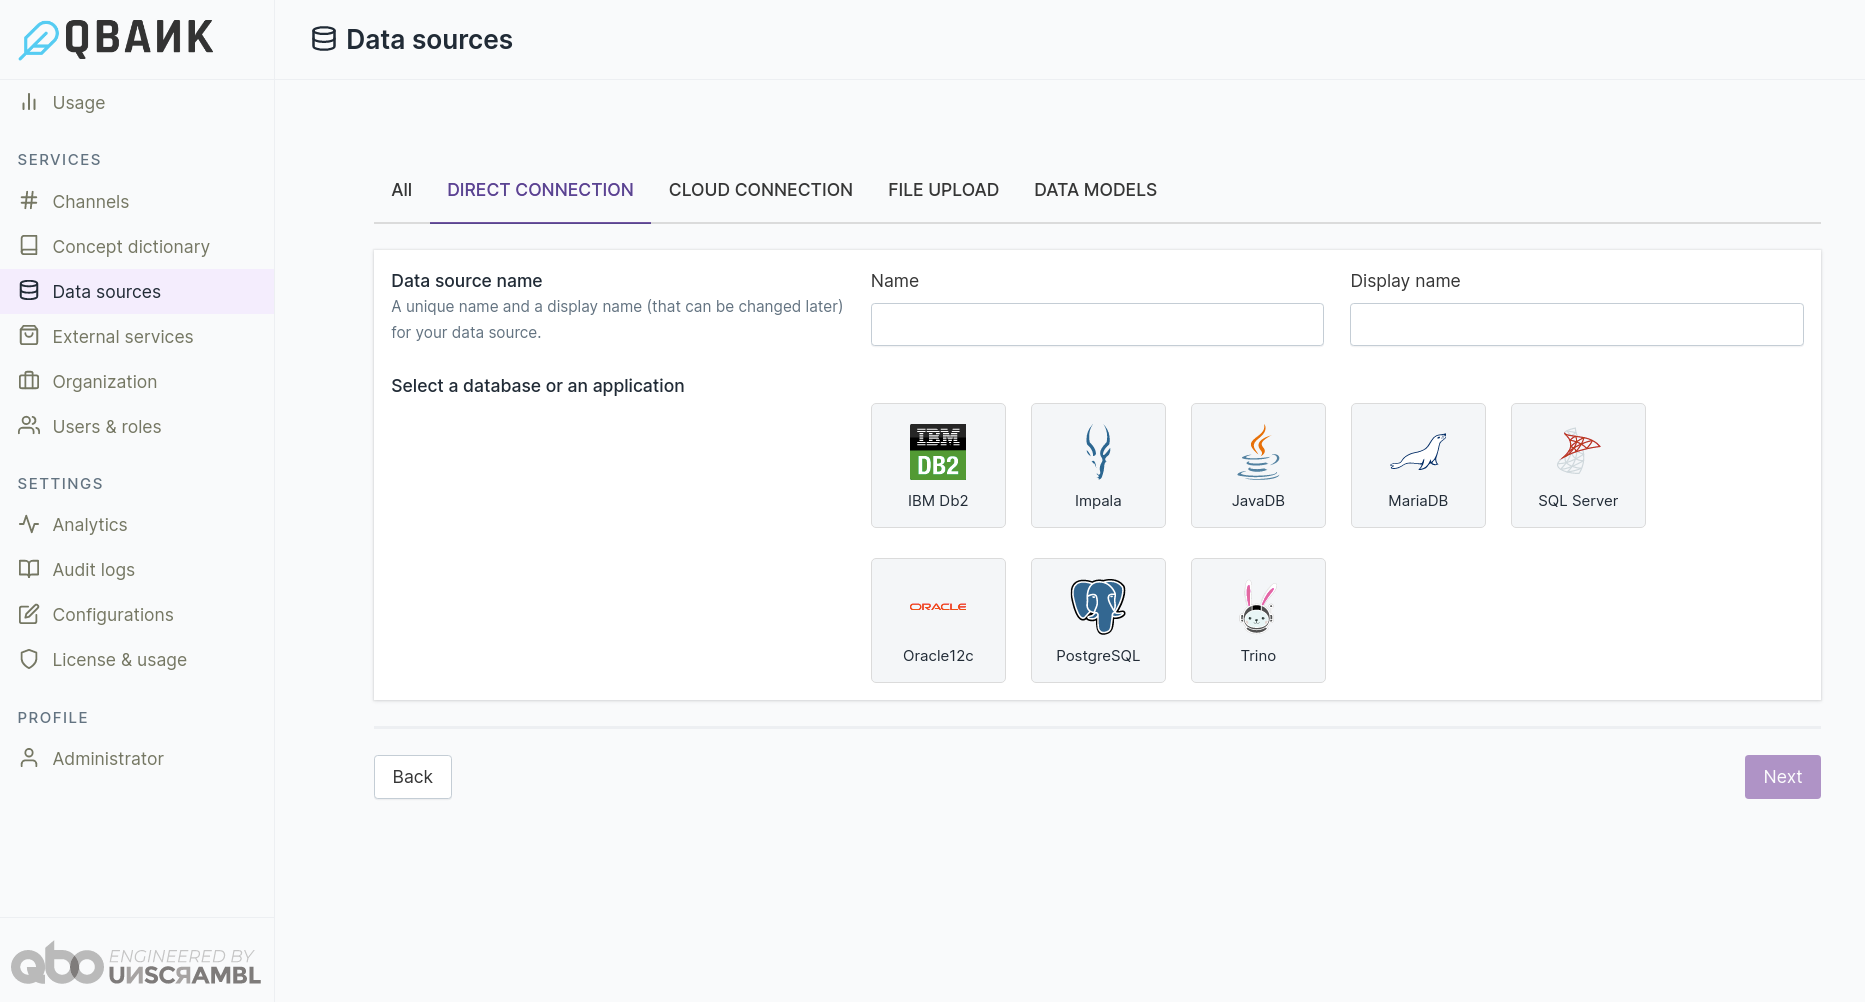
Enter a name for the data source and select the type of data source.
Note
Qbo supports these on-premises databases:
Impala
JavaDB
MariaDB
Microsoft SQL Server
Oracle Database
PostgreSQL
Presto
Trino
Note
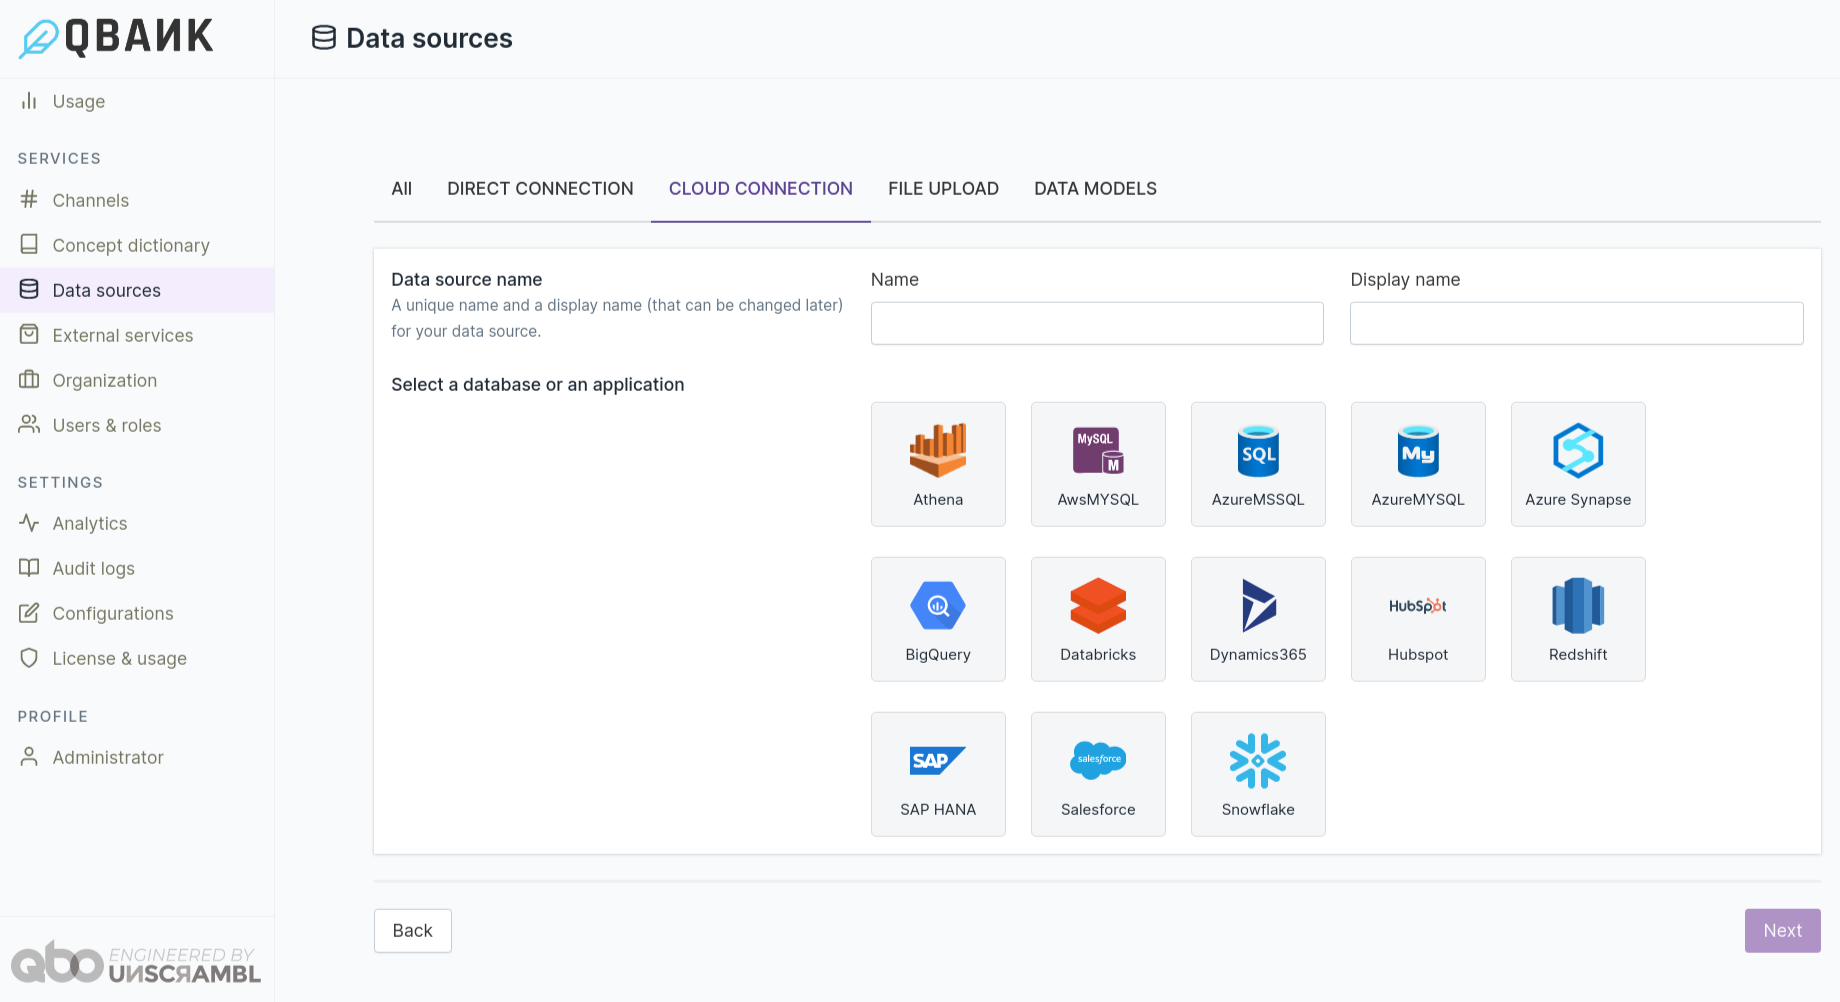
Qbo supports these cloud databases:
Athena
AzureSQL
Azure Synapse
BigQuery
Databricks
Dynamics365
HubSpot
Redshift
SAP HANA
Salesforce
Snowflake
Note
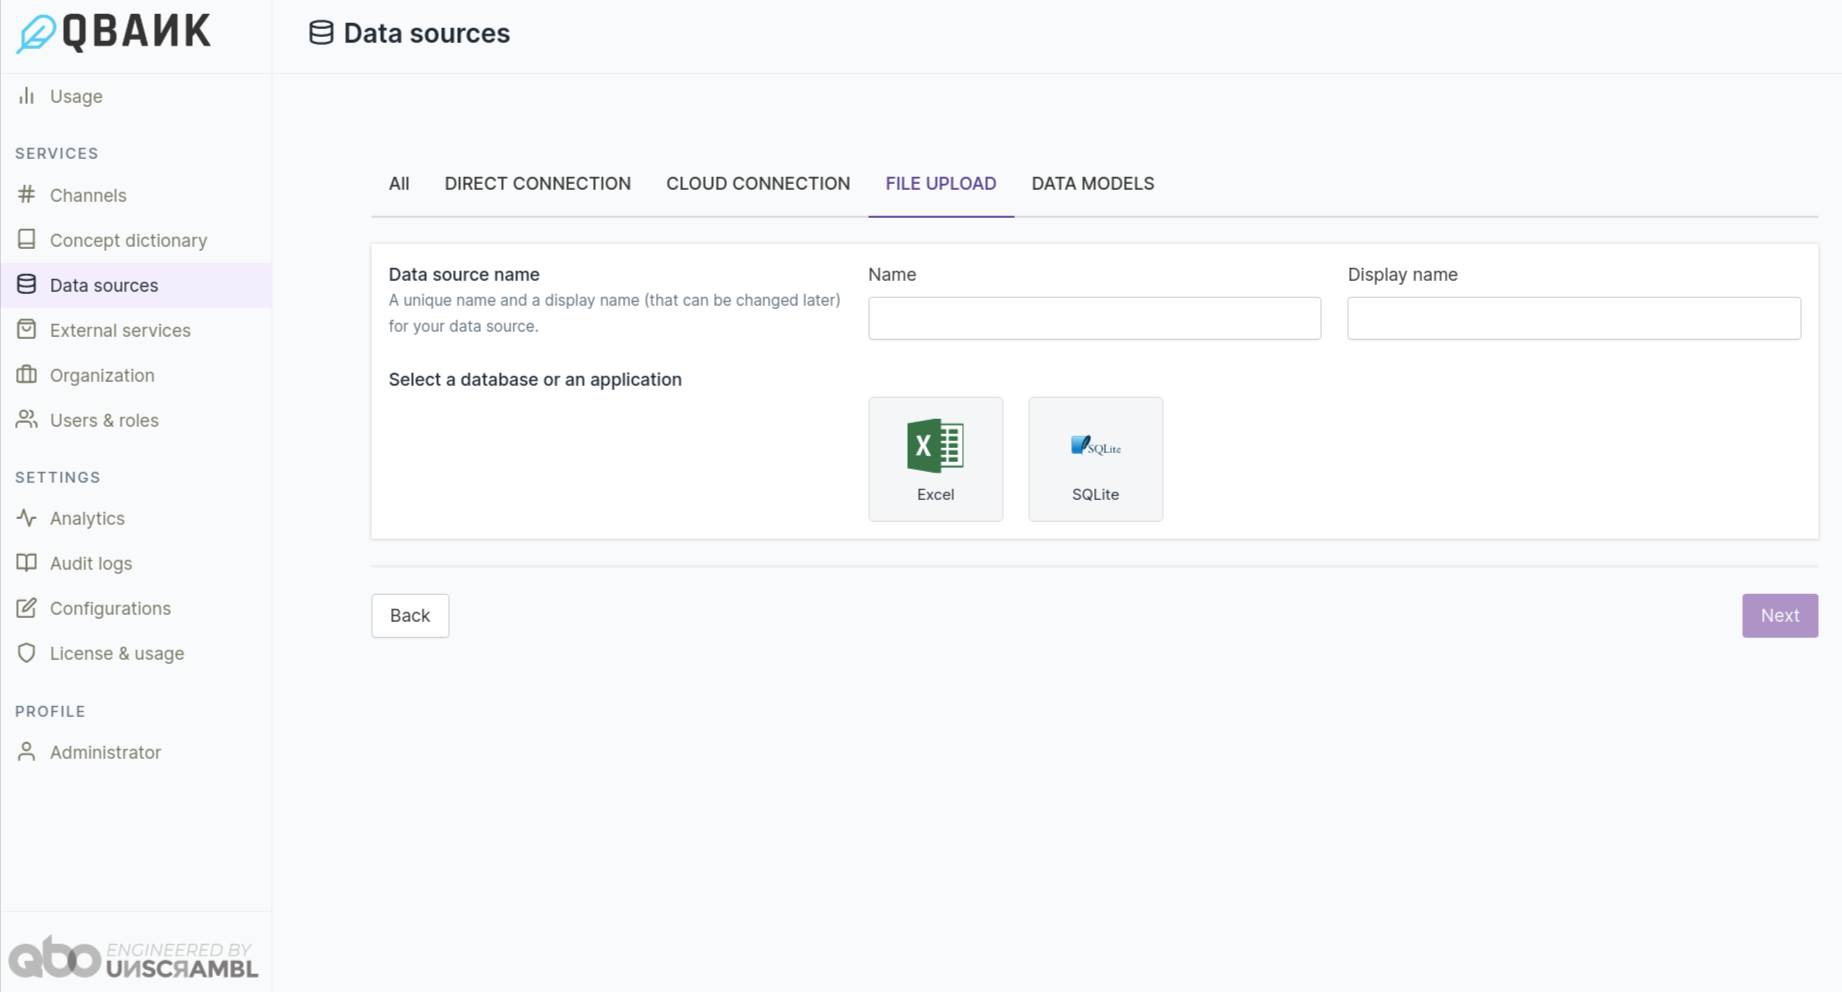
Qbo supports these file upload options:
Excel
SQLite
If your data sources are not listed above, please get in touch with helpdesk@unscrambl.com and the team might be able to assist you. Additional data sources are being added continuously.
The next screen asks for credentials corresponding to the selected data source.
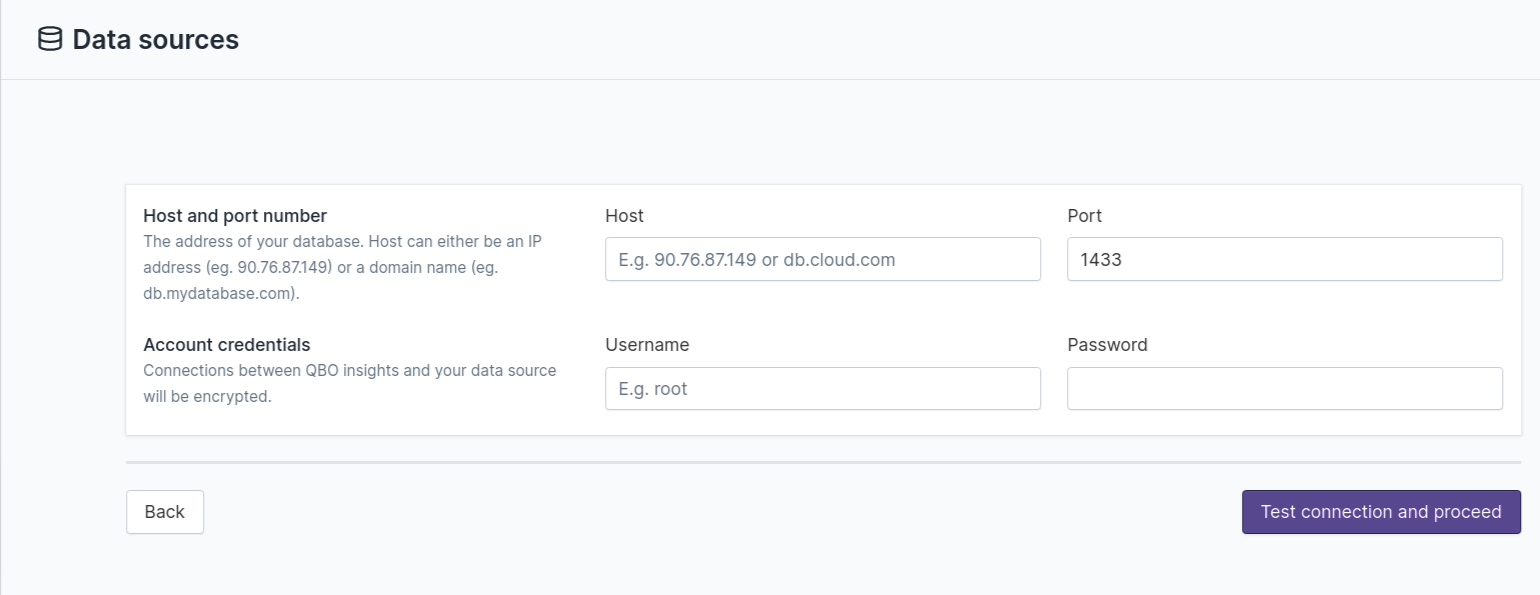
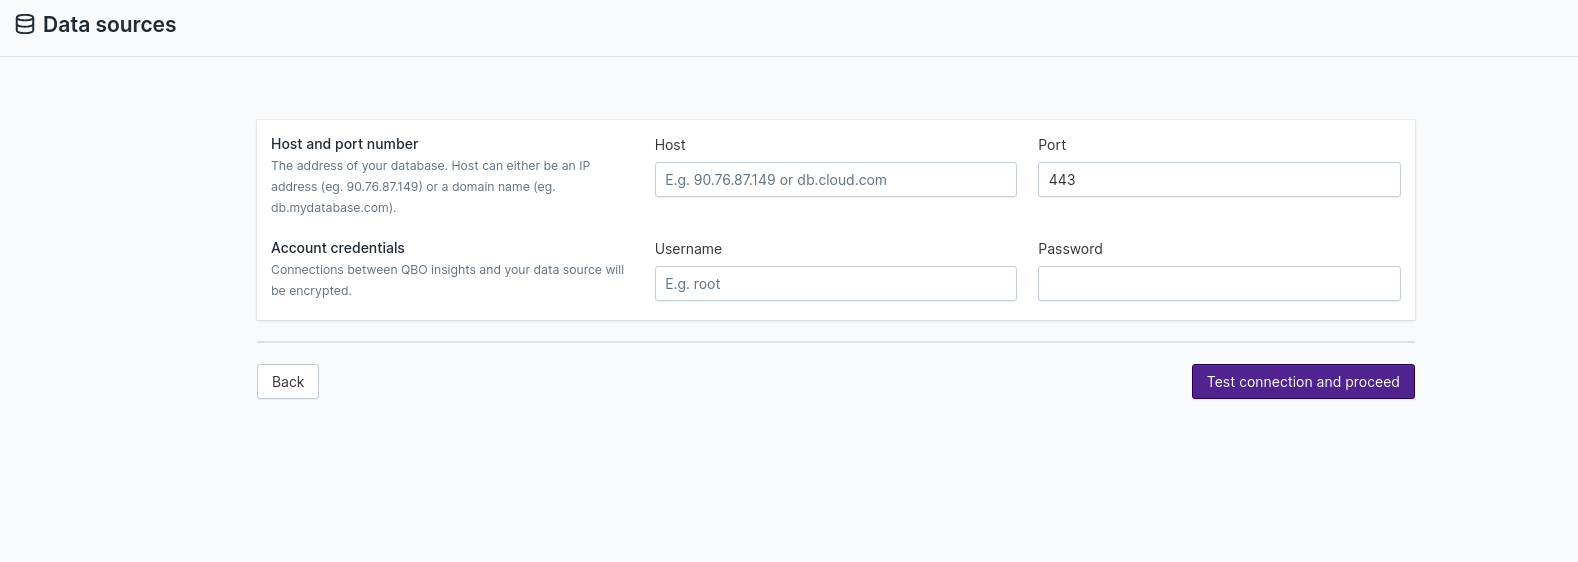
On-premises data sources
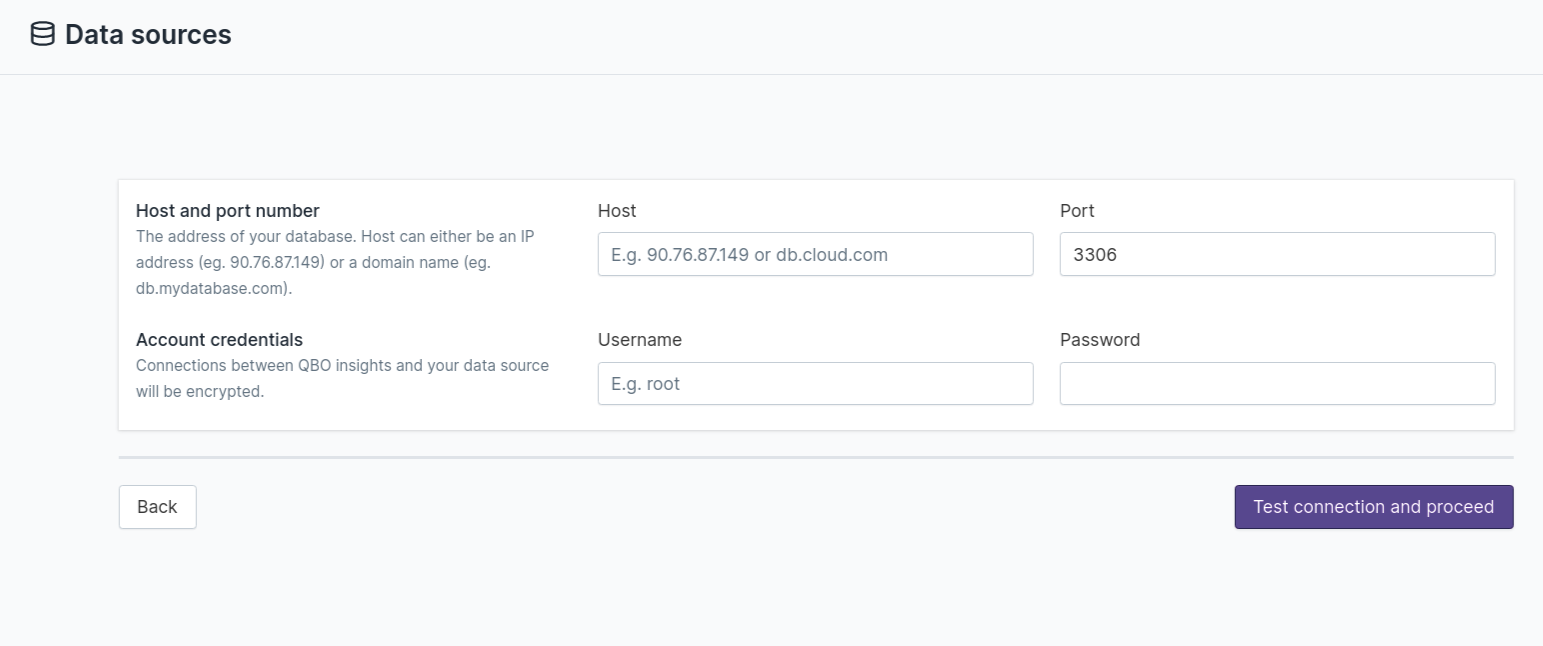
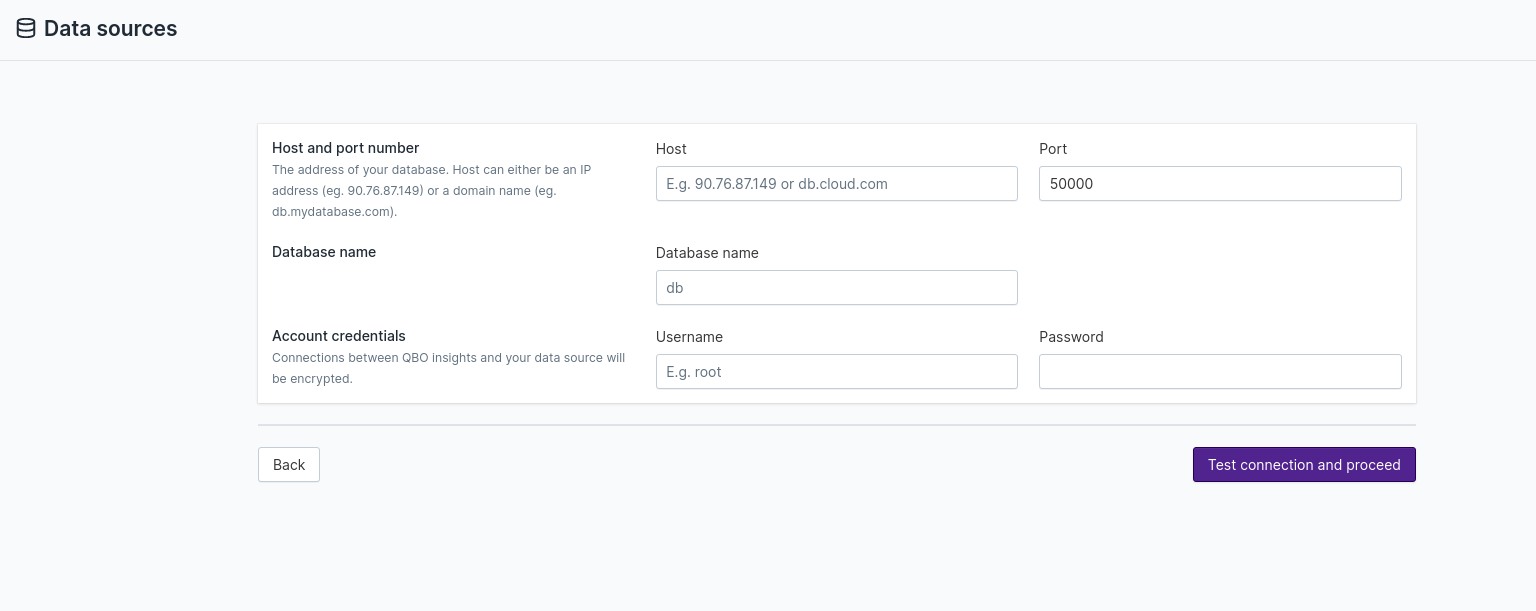
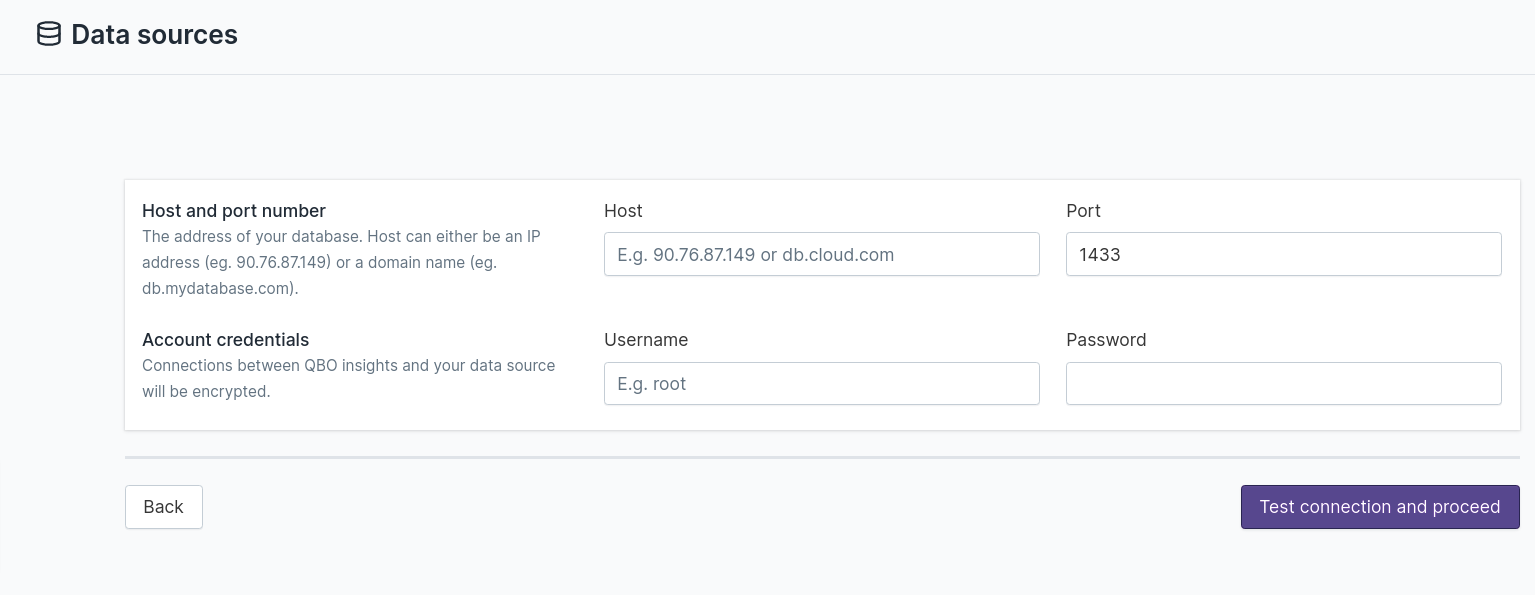
For all on-premises data sources, enter a hostname or IP address, port, database name, and a username and password that Qbo can use to access it.
If your data source is JavaDB, MariaDB, Microsoft SQL Server, MySQL, Oracle Database, or PostgreSQL, this is all the connection information that Qbo needs.
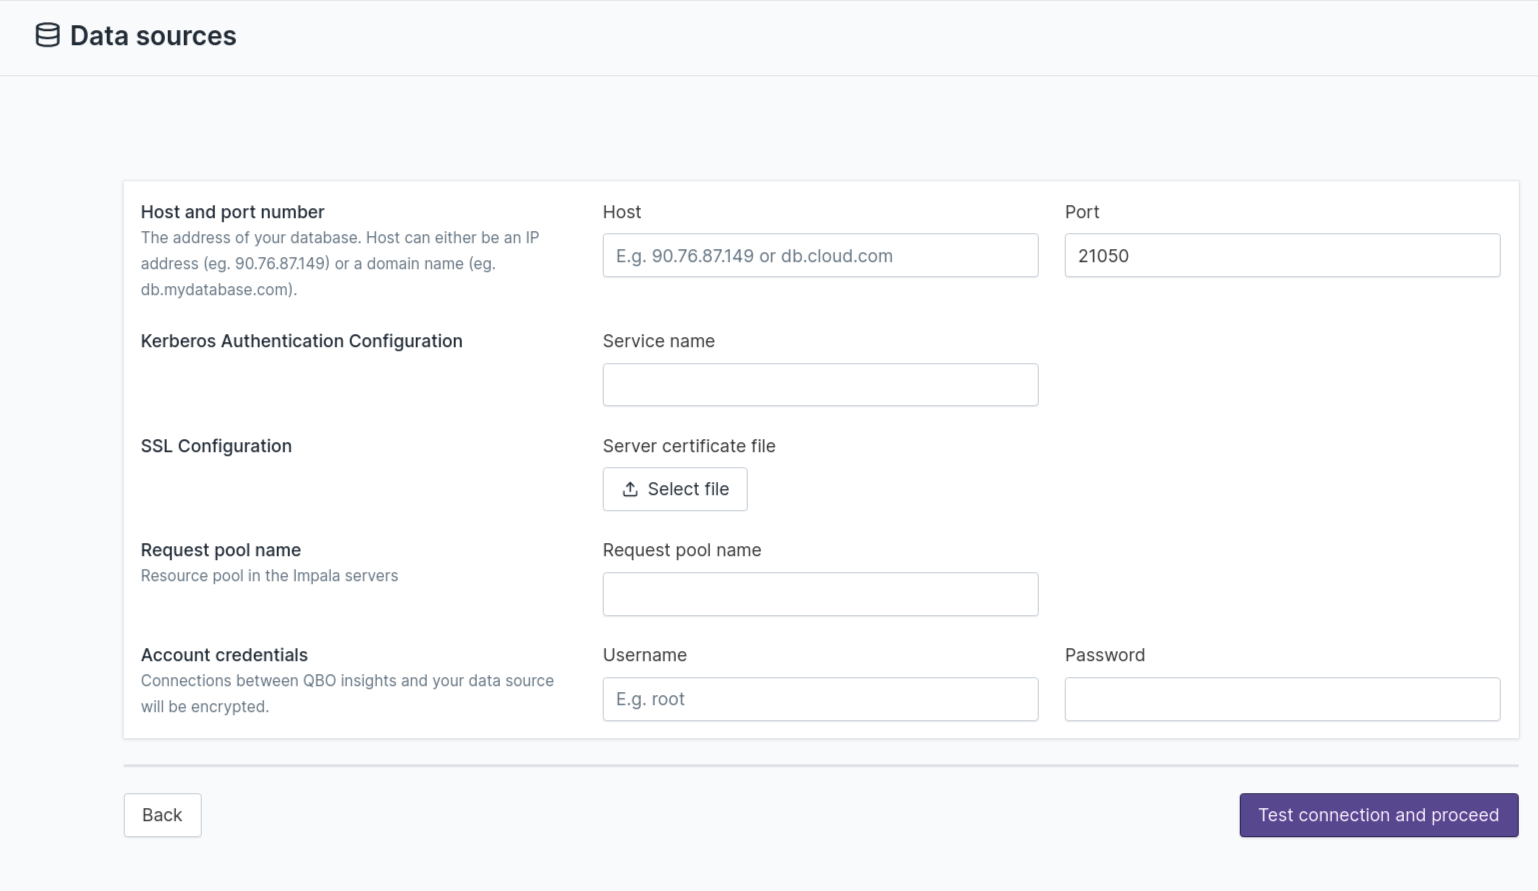
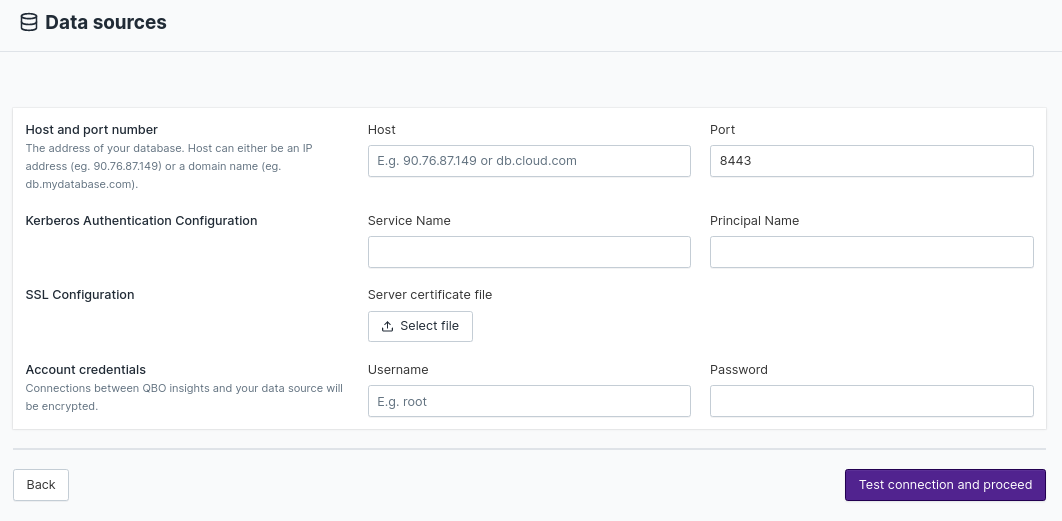
If your data source is Impala, Qbo also needs Kerberos authentication and SSL configuration information. Enter the name of the Impala service and the file path to the server’s SSL certificate.
If your data source is Presto, Qbo also needs Kerberos authentication and SSL configuration information. Enter the name of the Presto service, the name of the Kerberos principal, the file path to the server’s SSL certificate, and the Presto catalog.
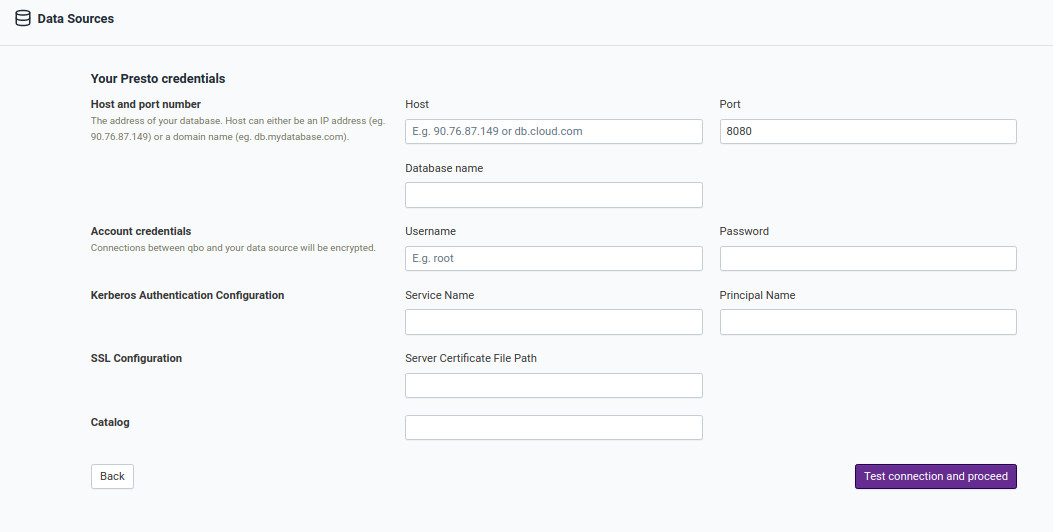
Click Test connection and proceed.
If your data source is Trino, Qbo also needs Kerberos authentication and SSL configuration information. Enter the name of the Trino service, the name of the Kerberos principal and the file path to the server’s SSL certificate.
Click Test connection and proceed.
If your data source is IBM Db2, enter the address and port of the database, the name of the database, and the username and password of an account that Qbo can use to connect to it.
Cloud data sources
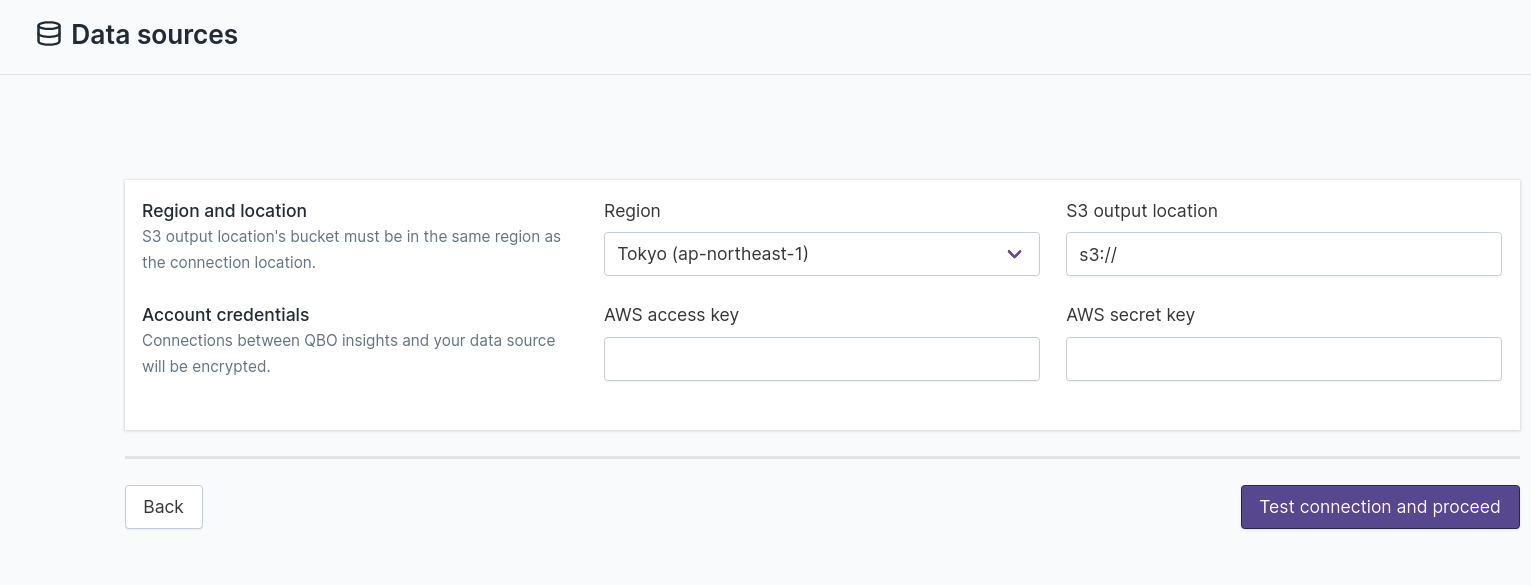
Athena
To connect to a cloud Athena data source, select an S3 region and enter the S3 output location and database name. Enter the AWS access key and secret key that Qbo will need to access the data source.
The region for an S3 output bucket’s location must be in the same region as the connection location.
Note
To get your Access Key ID and Secret Access Key:
Open the IAM console.
From the navigation menu, click Users.
Select your IAM user name.
Click User Actions, then Manage Access Keys.
Click Create Access Key. Your keys will look something like this: > Access key ID:
AKIAIOSFODNN7EXAMPLE> Secret access key:wJalrXUtnFEMI/K7MDENG/bPxRfiCYEXAMPLEKEYClick Download Credentials.
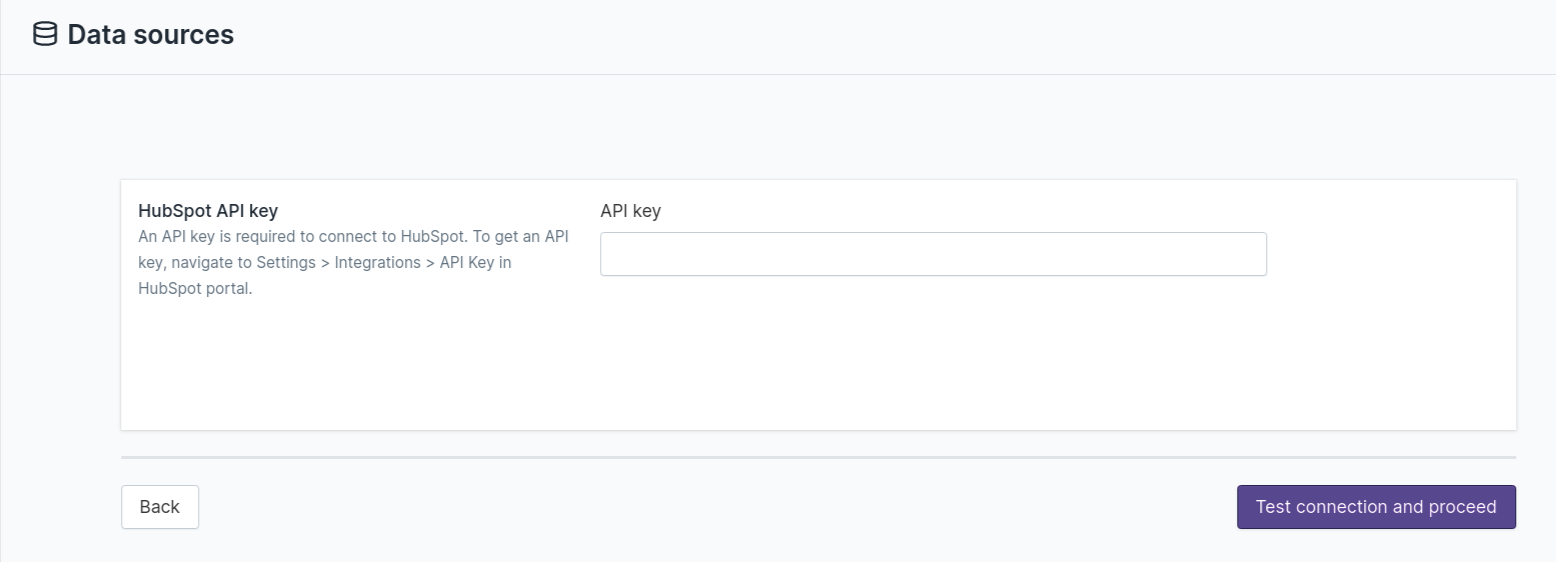
HubSpot
To connect to a cloud HubSpot data source, enter the API key provided by HubSpot.
Note
To get your HubSpot API key:
In your HubSpot account, click the settings icon in the main navigation bar.
In the sidebar menu, navigate to Integrations > API key.
If a key has never been generated for your account, click Generate API key.
If you’ve already generated an API key, click Show to display your key.
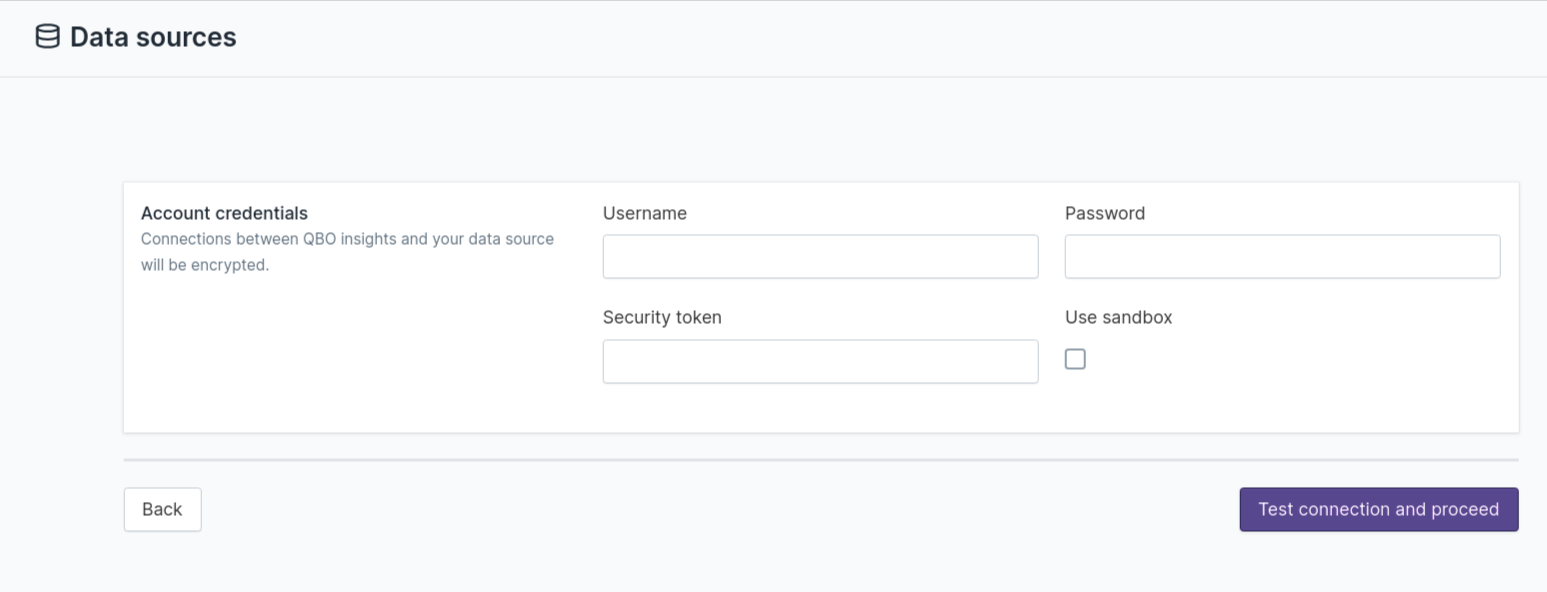
Salesforce
To connect to a cloud Salesforce data source, enter a username, password, and security token.
Note
A security token is an automatically generated key that you must add to the end of your password to log in to
Salesforce from an untrusted network.
For example, if your password is mypassword and your security token is XXXXXXXXXX, enter
mypasswordXXXXXXXXXX to log in.
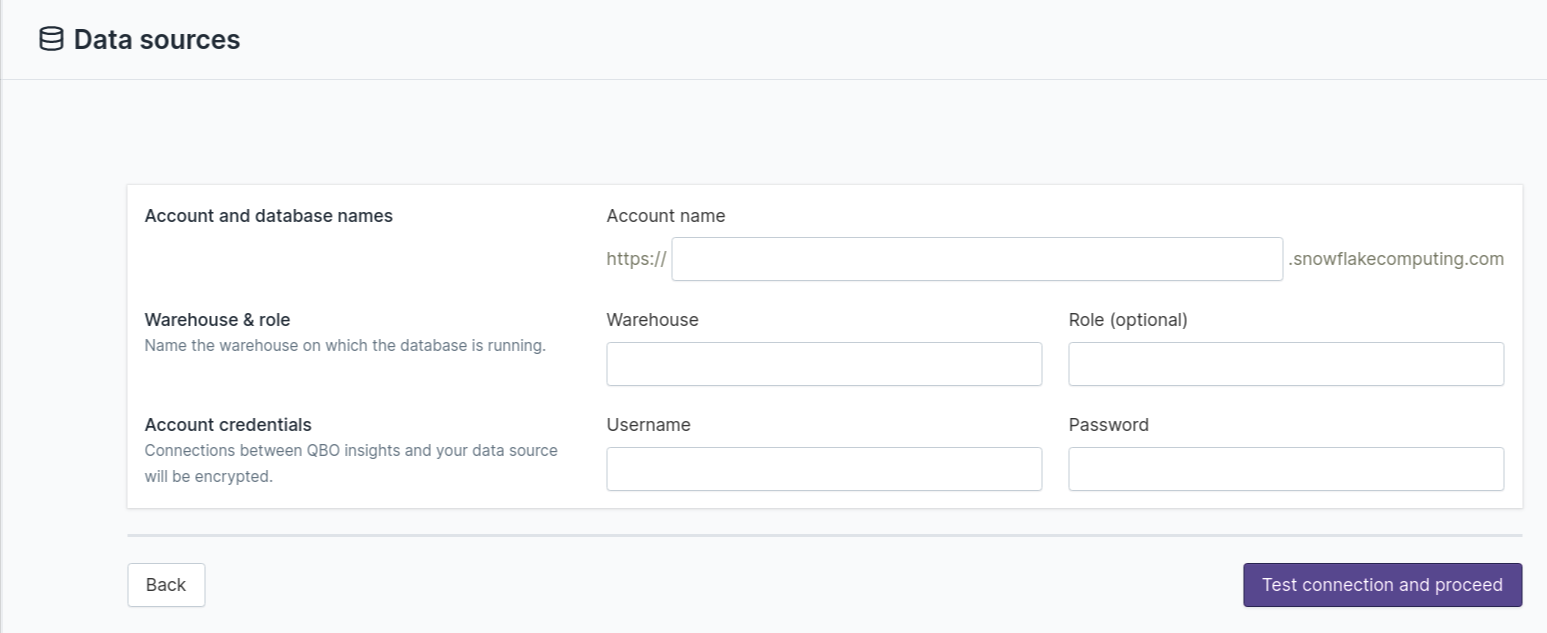
Snowflake
To connect to a cloud Snowflake data source, enter an account name, the name of the database (case sensitive), the warehouse on which the database is running, a role (optional), and the username and password of an account that Qbo can use to connect to it.
Note
Account name: your account name is the entire string to the left of snowflakecomputing.com.
For example, https://myaccountname.snowflakecomputing.com
AzureSQL
To connect to a cloud AzureSQL data source, enter the address and port of the database, the name of the database, and the username and password of an account that Qbo can use to connect to it.
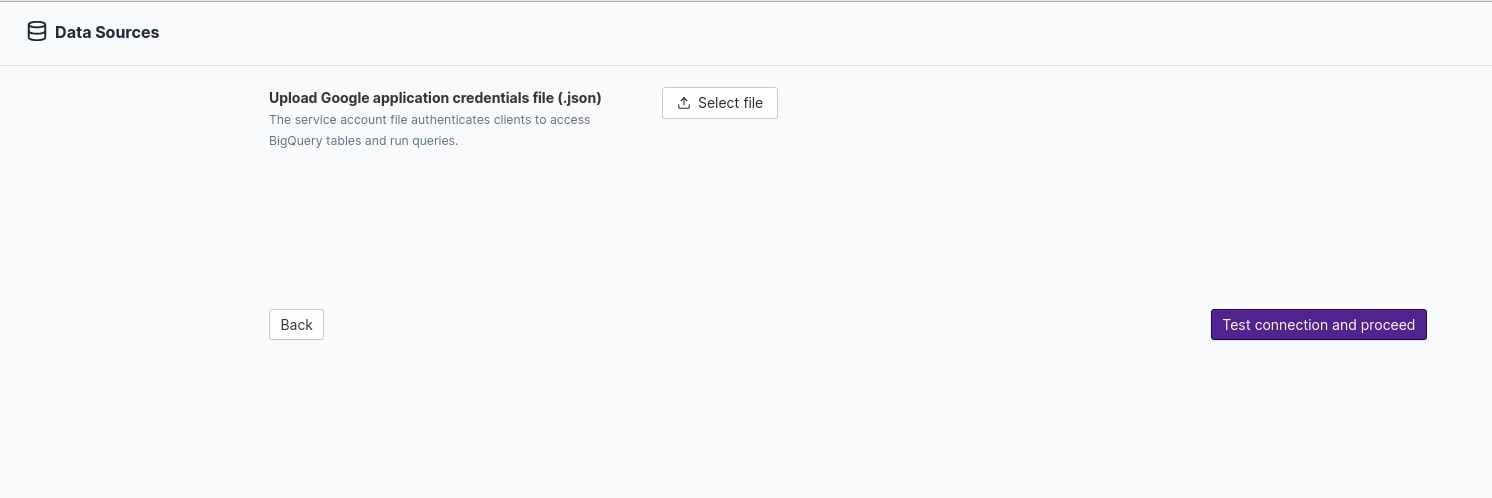
BigQuery
To connect to a cloud BigQuery data source, click on Select file to browse to a Google application
credentials file. This file should have a .json extension.
Find out more about Google application credentials file.
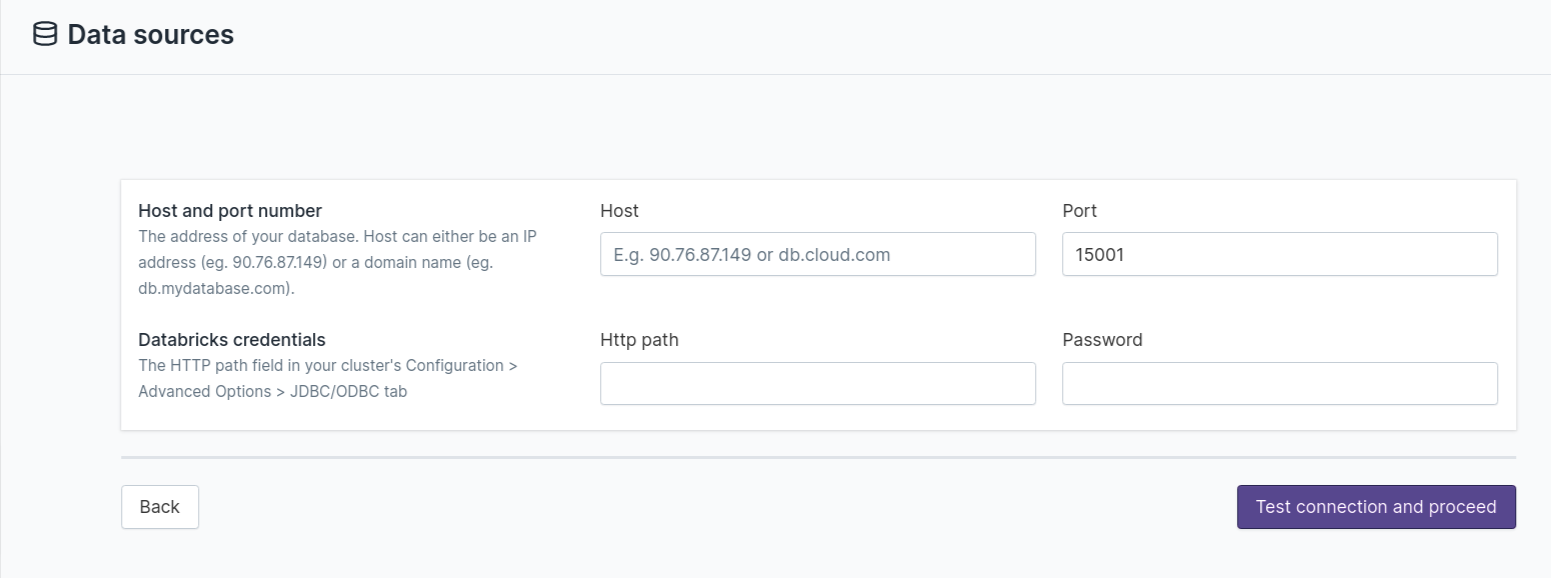
Databricks
To connect to a cloud Databricks data source, enter the address and port of the database, the name of the database, and the path to the credentials file and the password for an account that Qbo can use to connect to it.
AzureSynapse
To connect to a cloud AzureSynapse data source, enter the address and port of the database, the name of the database, and the username and password of an account that Qbo can use to connect to it.
Redshift
To connect to a cloud Redshift data source, enter the address and port of the database, the name of the database, and the username and password of an account that Qbo can use to connect to it.
SAP HANA
To connect to a cloud SAP HANA data source, enter the address and port of the database,the username and password of an account that Qbo can use to connect to it.
File upload
Excel
File restrictions: must be an .xls file, version 2010 or later, and a maximum of 50MB in size.
To connect to an Excel file as a data source:
Click Select file to browse to the file you want to use.
Enter the range of cells that hold the data you want Qbo to access. If an Excel file has more than one sheet, include the sheet name with the cell range. You can enter multiple ranges on the same or different sheets; separate these with a comma. For example, if your file has two sheets,
netflix_movieswith data in 48 rows in columns A to I;netflix_serieswith data in 6235 rows in columns A to K, then you would enternetflix_movies!A1:I48,netflix_series!A1:K6235.Enter
VerticalorHorizontalfor the orientation.Select
ColumnFormat,RowScan, orNonefrom Type detection scheme.Enable Has cross-sheet references if the spreadsheet contains cell formulas that reference cells in different sheets.
Enable Header if the sheet has row or column headings.

Qbo will add each sheet in the spreadsheet as a table.
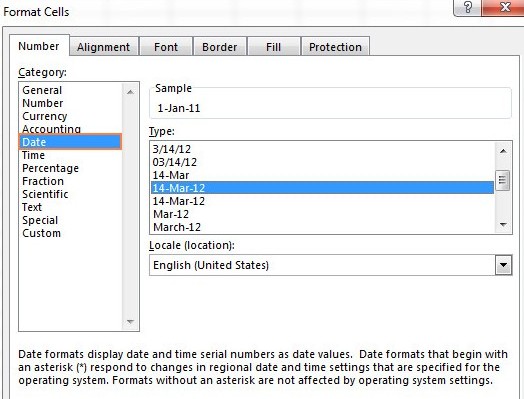
Data types in Excel are interpreted as String, Double or Datetime in Qbo. For example, this Excel sheet with various data types:
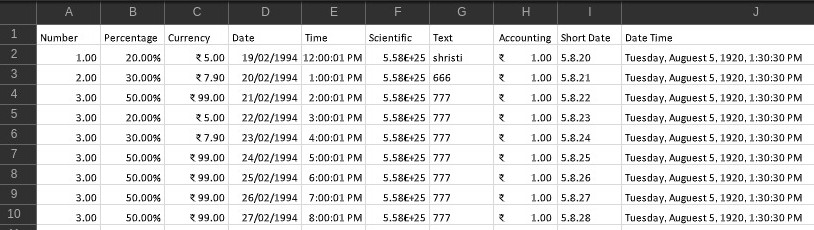
Qbo will interpret these formats as:
Note
If you have a spreadsheet in a different file format - for example, Google Sheets or Libre Office - convert it to Excel format before processing it in Qbo.
Check the data type of each spreadsheet column. Qbo needs to identify the data type correctly. Convert your column type to double, date, or string as needed.
Columns of type
Numberin Excel are interpreted in Qbo as Double, even if they contain only integers.Columns of type
Dateare interpreted in Qbo as DateTime.Excel only supports String, Double, and Datetime data types.
Note
Start the data from the top left and use ColumnFormat for data types.
If extra columns are shown in your logical data model, you can safely delete them from the model.
If RowId is added as a new Integer attribute, you can choose to delete it.
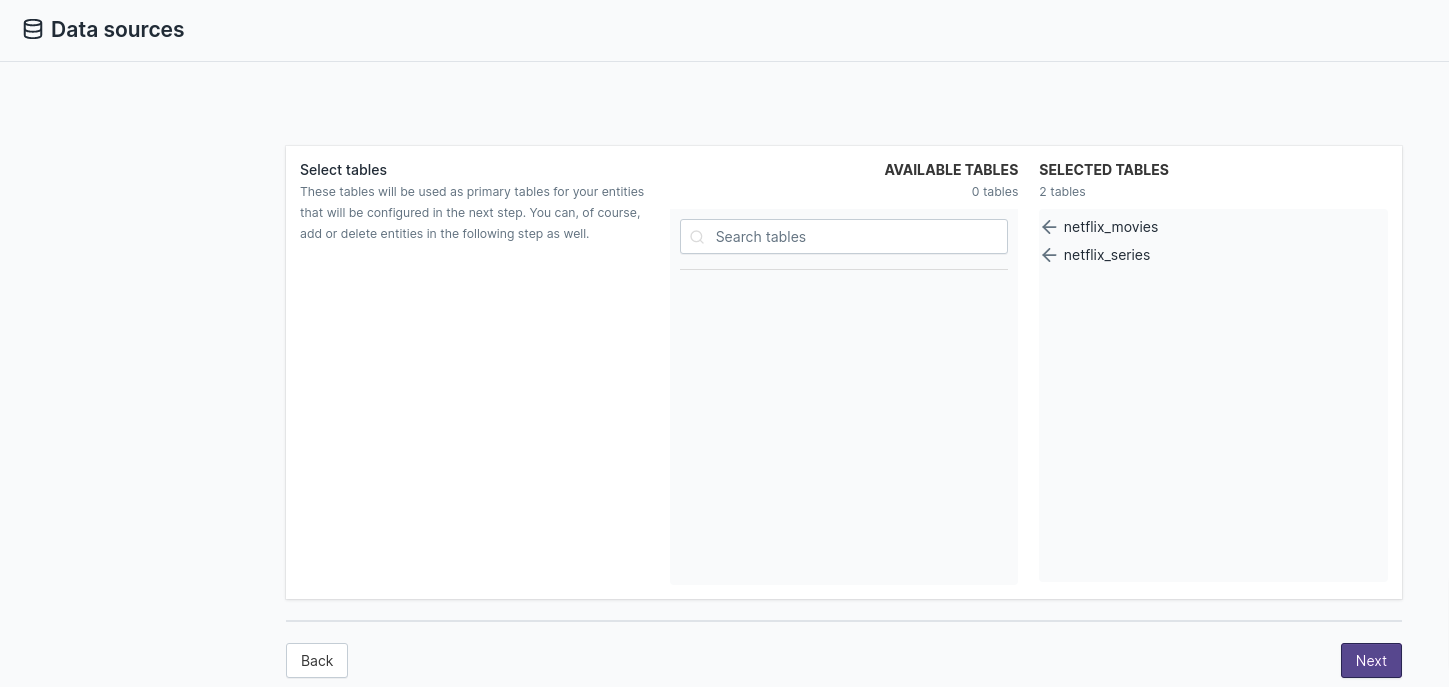
Qbo can automatically fetch the schema information from the selected data source and display it. Select the tables that you want to query for the data source being configured.
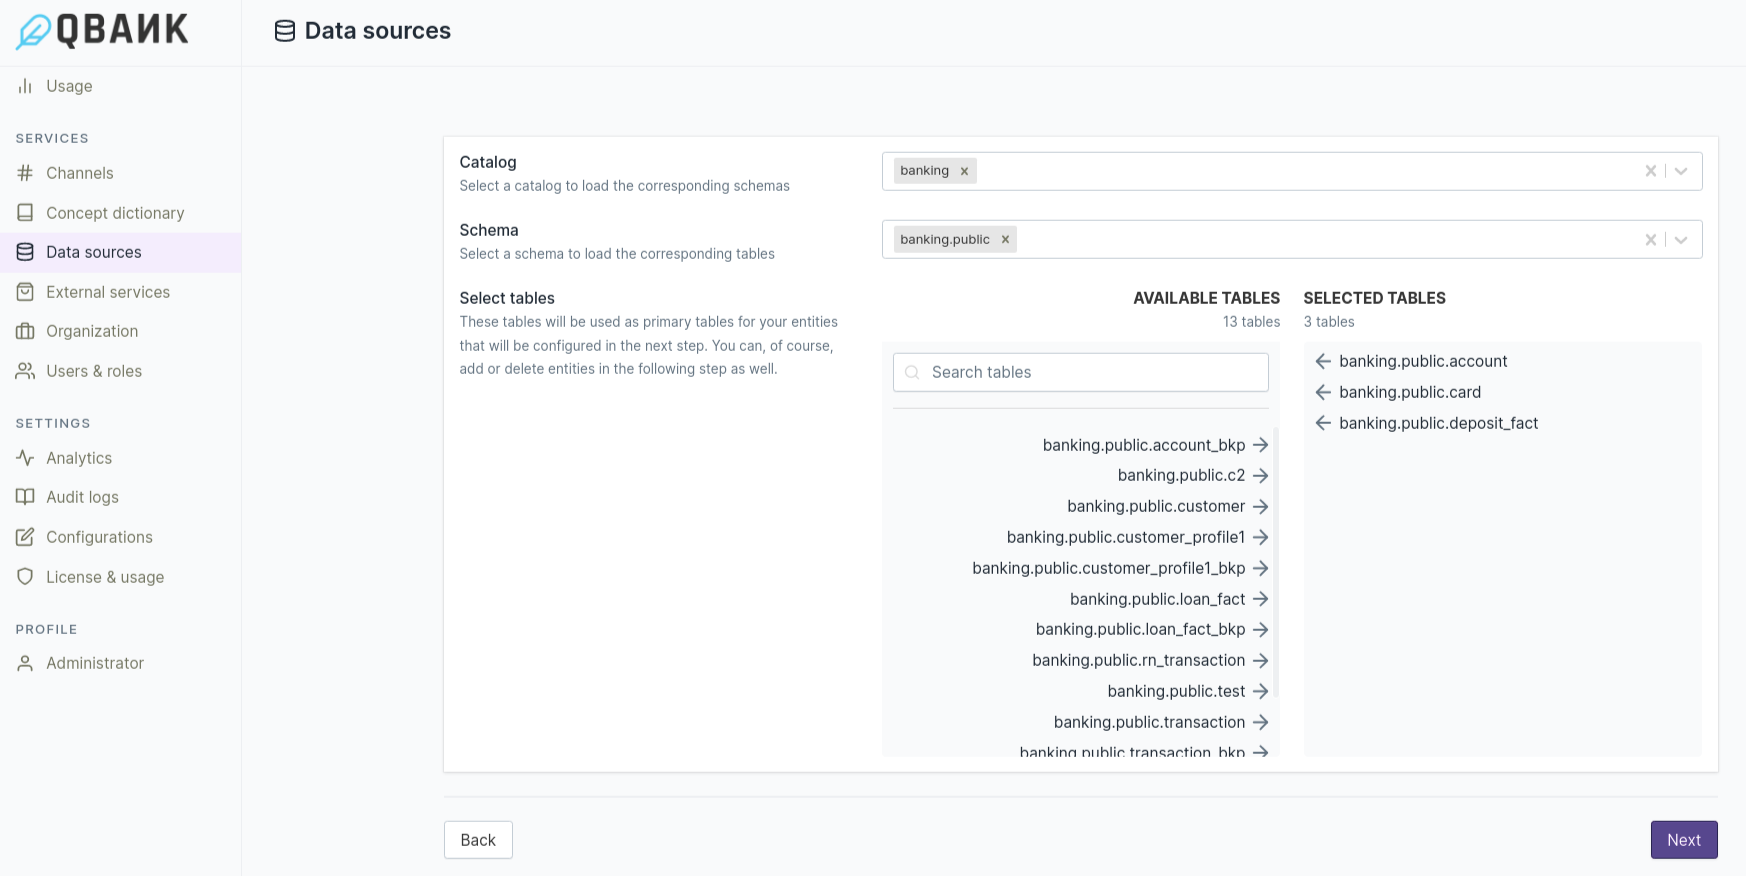
More tables can be added later, and very often configuring the data model is an iterative process.
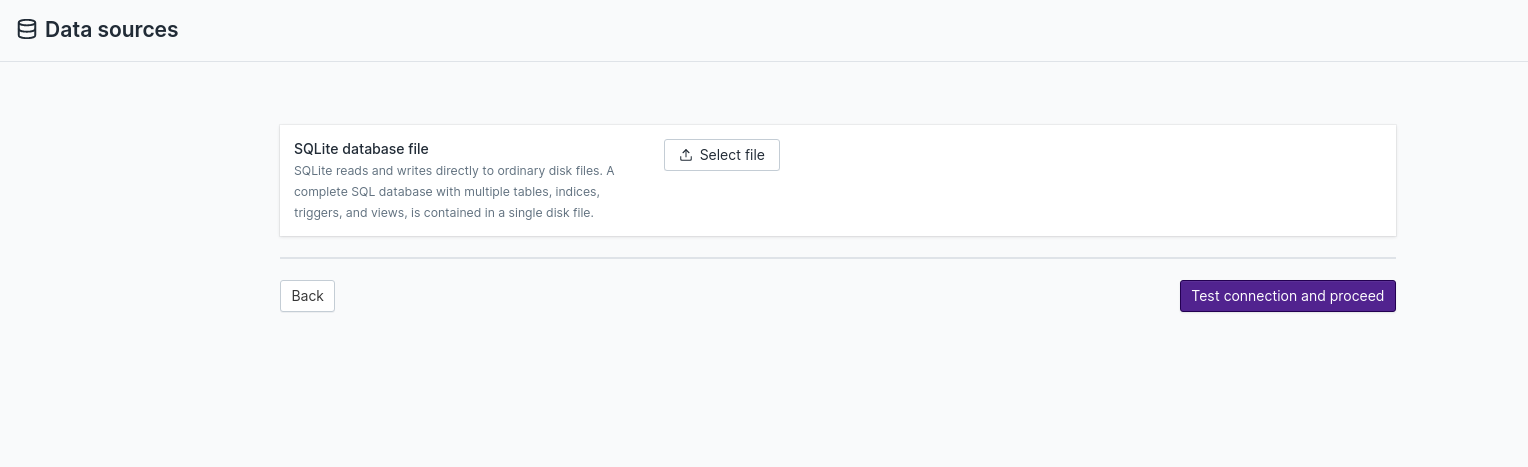
SQLite
To connect to an SQLite data source, Qbo needs an SQLite database file.
Find out more about SQLite database file.
Data Source Settings
To configure a data source, click ![]() on the right side of the data source section.
on the right side of the data source section.
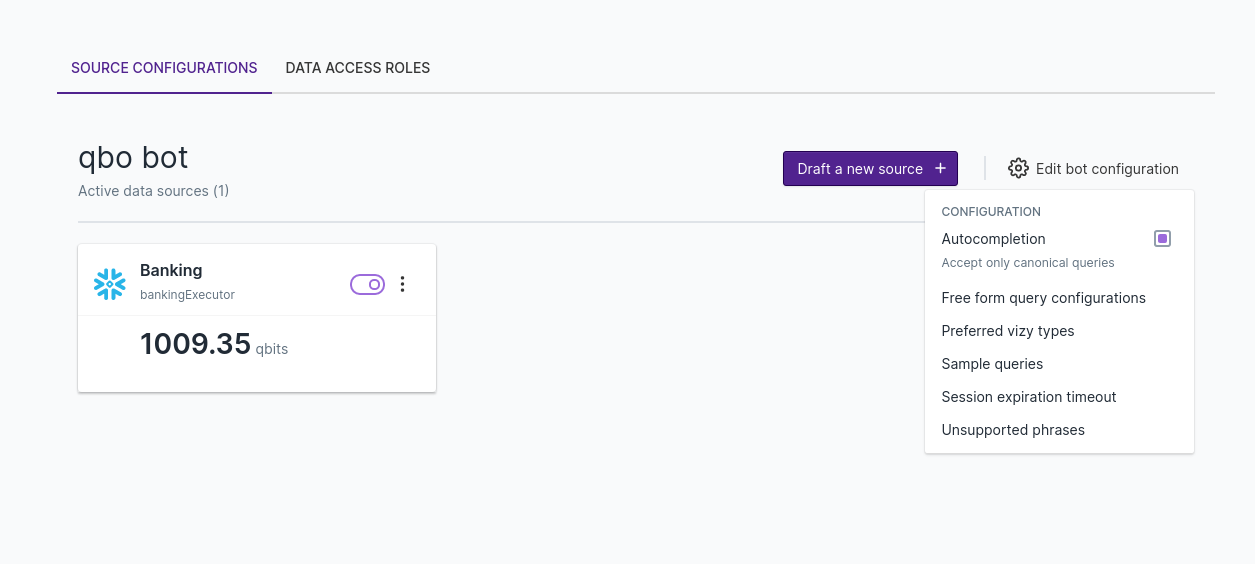
Autocompletion
This is used to accept only canonical queries.
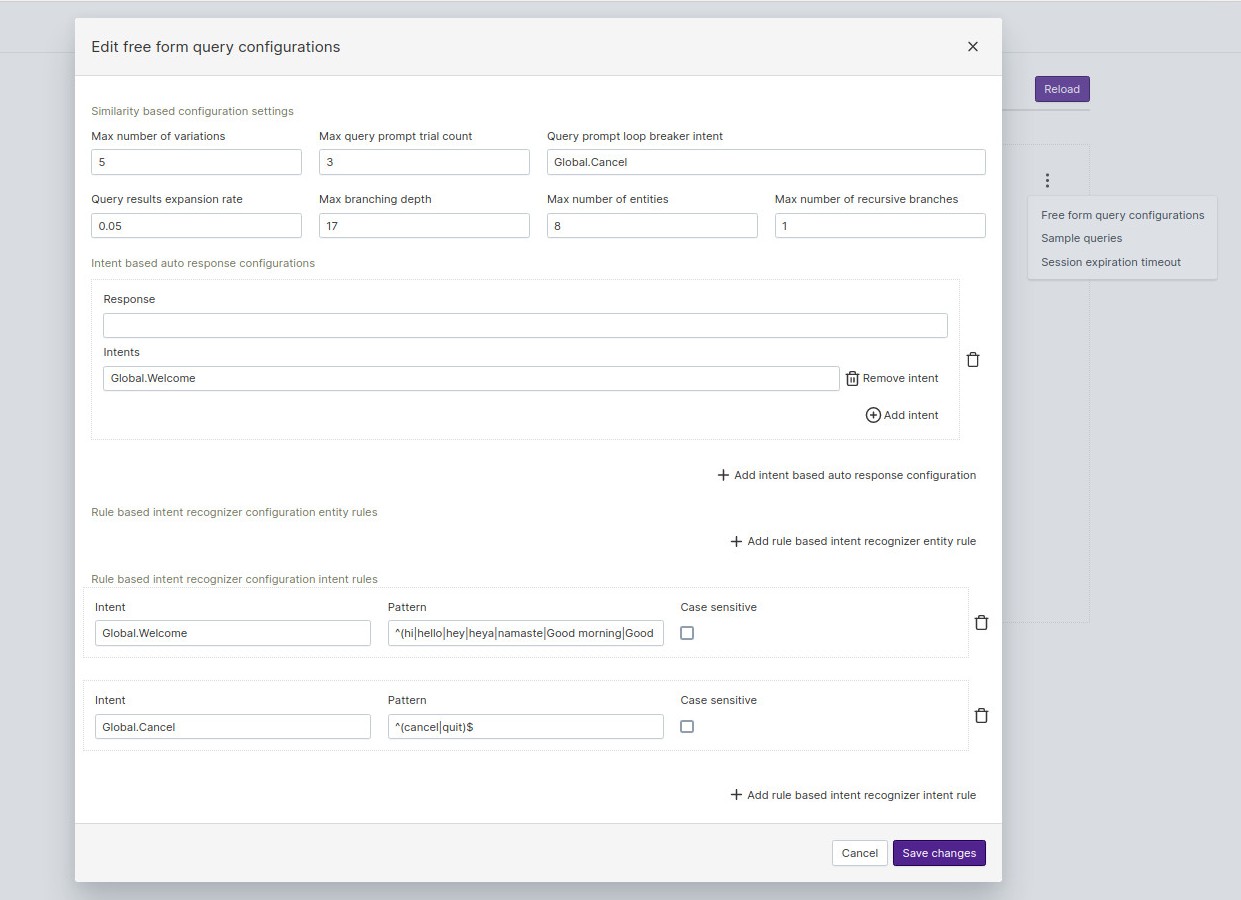
Freeform query configuration
Qbo uses the NLP model to understand user queries with no prior training, data preparation or human-driven model building. The options in the free form query configurations section are:
Max number of variations: If Qbo encounters ambiguity, this specifies the maximum number of alternative canonical query variations with which it should prompt the user.
Max query prompt trial count: If Qbo receives an unclear query with missing attributes, this specifies the maximum number of clarification questions that it should ask for the same missing attribute. If the user cannot provide a valid answer to fill the missing attribute within the trial count, Qbo will stop trying to resolve the current query and ask for the next one.
Query prompt loop breaker intent: If Qbo receives an unclear query with missing attributes, this specifies the name of the resolved intent for the user input to break the clarification questions loop. After breaking the clarification loop, Qbo will ask for the next query.
Query results expansion rate: The canonical query results returned by the similarity recognizer are scored according to their attributes. The highest scoring result is returned as the similarity result. If there are query results with very close scores, the query results expansion rate serves to add these query results to the similarity result as alternatives.
Response: Defines the automatic response that Qbo should give if the user’s query matches the intent.
Intents: Defines the intent names, which will be answered with the automatic response. The intent recognition rules are defined in Rule based intent recognizer configuration intent rules.
Rule based intent recognizer configuration intent rules
Intent: A descriptive name for the intent.
Pattern: The pattern to be recognized as an intent. The user’s query is matched against this pattern.
Max branching depth: Maximum depth of the grammar tree used to build a query template. Deeper trees might result in more complex query templates.
Max number of entities: Maximum number of entities allowed to be present in a query template.
Max number of recursive branches: Maximum number of allowed recursions in the same branch of the grammar tree. Usually used to implement conjunctions of the same grammar clause.
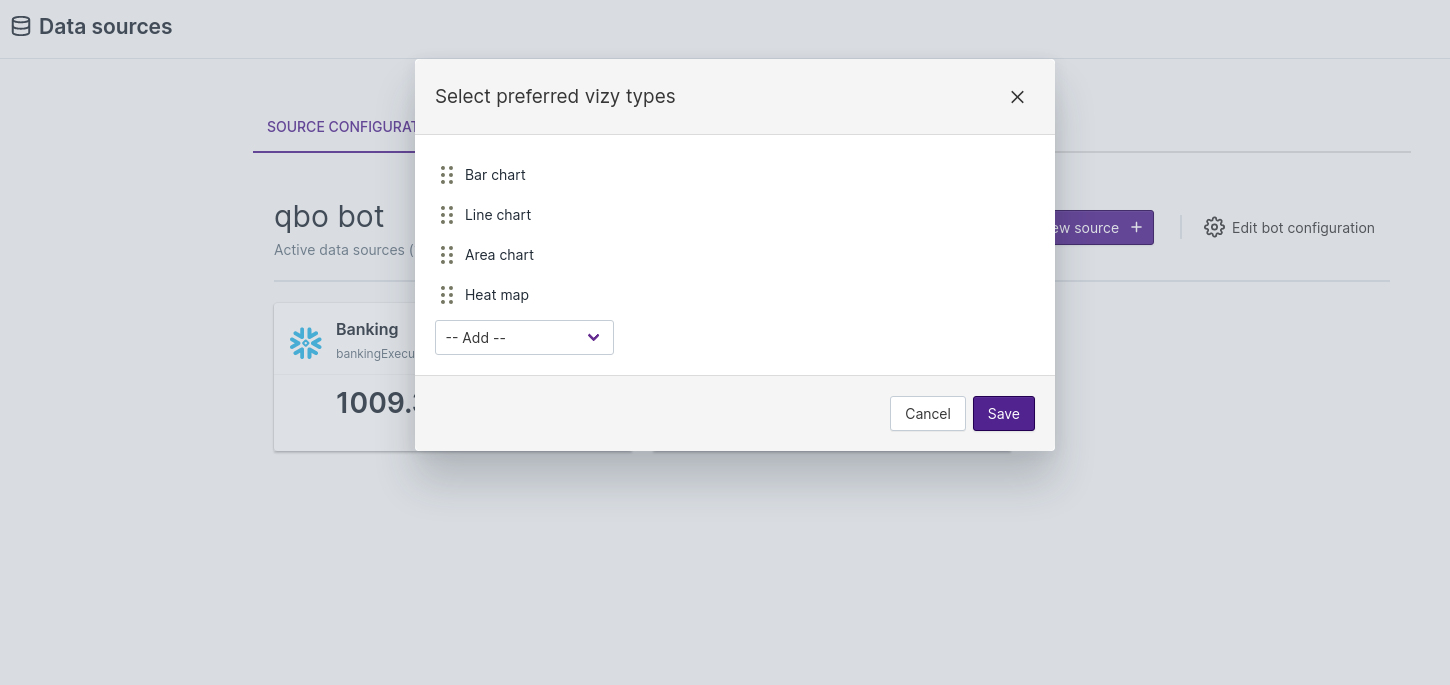
Preferred vizy types
If you have a preference for output visualizations - for example, you usually prefer a bar chart over a line chart - you can order vizy types from most to least preferred. This will override the QBO algorithm to decide the preferred vizies for the output; it will select your preference set here instead.
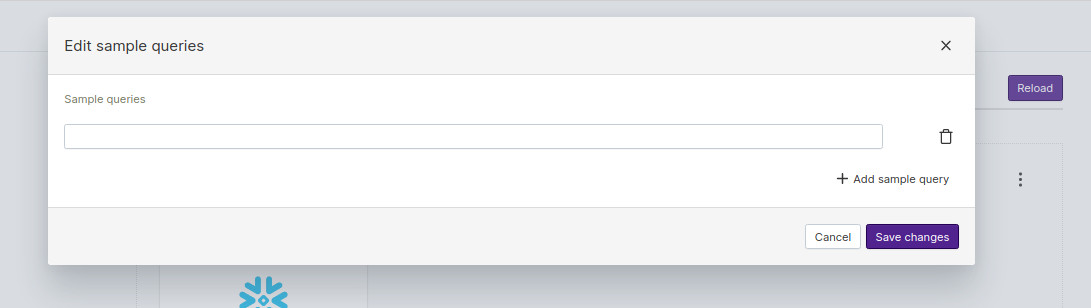
Sample Queries
This option is used to provide a list of possible example queries that current Qbo instances can answer. These sample queries are picked by the help command in MS Teams.
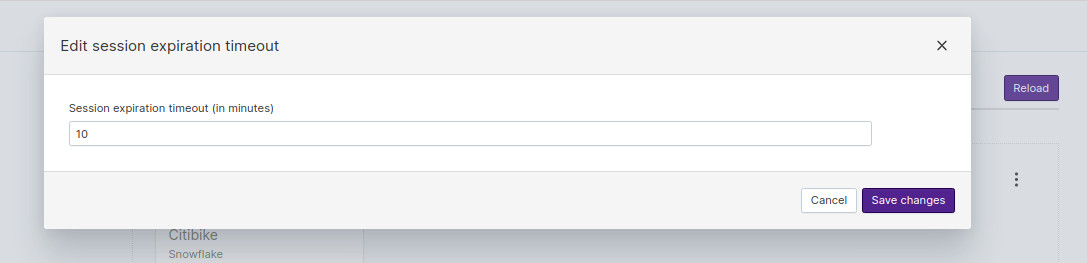
Session timeout expiration
This option is used to set a timeout for the Qbo server in minutes.
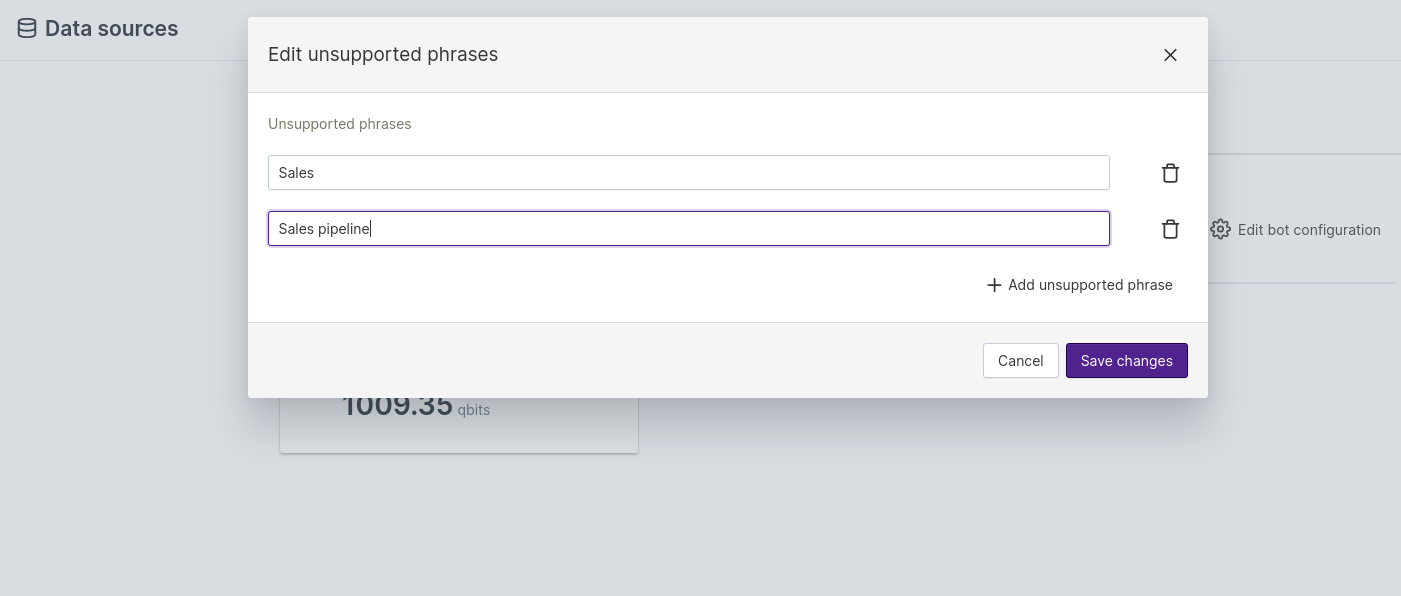
Unsupported phrases
Unsupported phrases are keywords, names, or phrases that are not part of the data model. By default, if Qbo cannot match a keyword to its logical model of the available data, it will respond with, “Sorry, I am not able to understand the query.”
However, if the end user asks a question that uses a keyword in the list of unsupported phrases, Qbo will respond with, “The phrase(s) may not be present in the database or may not be defined in the logical model of the data. Please contact your admin.”
Revert to an older version of the draft in data source configuration
Qbo allows you to save your draft while making changes to its configuration. You can have multiple draft versions of a configuration.
Click the Save Draft button to save a draft configuration. You can find the new draft data source configuration in your data sources view.
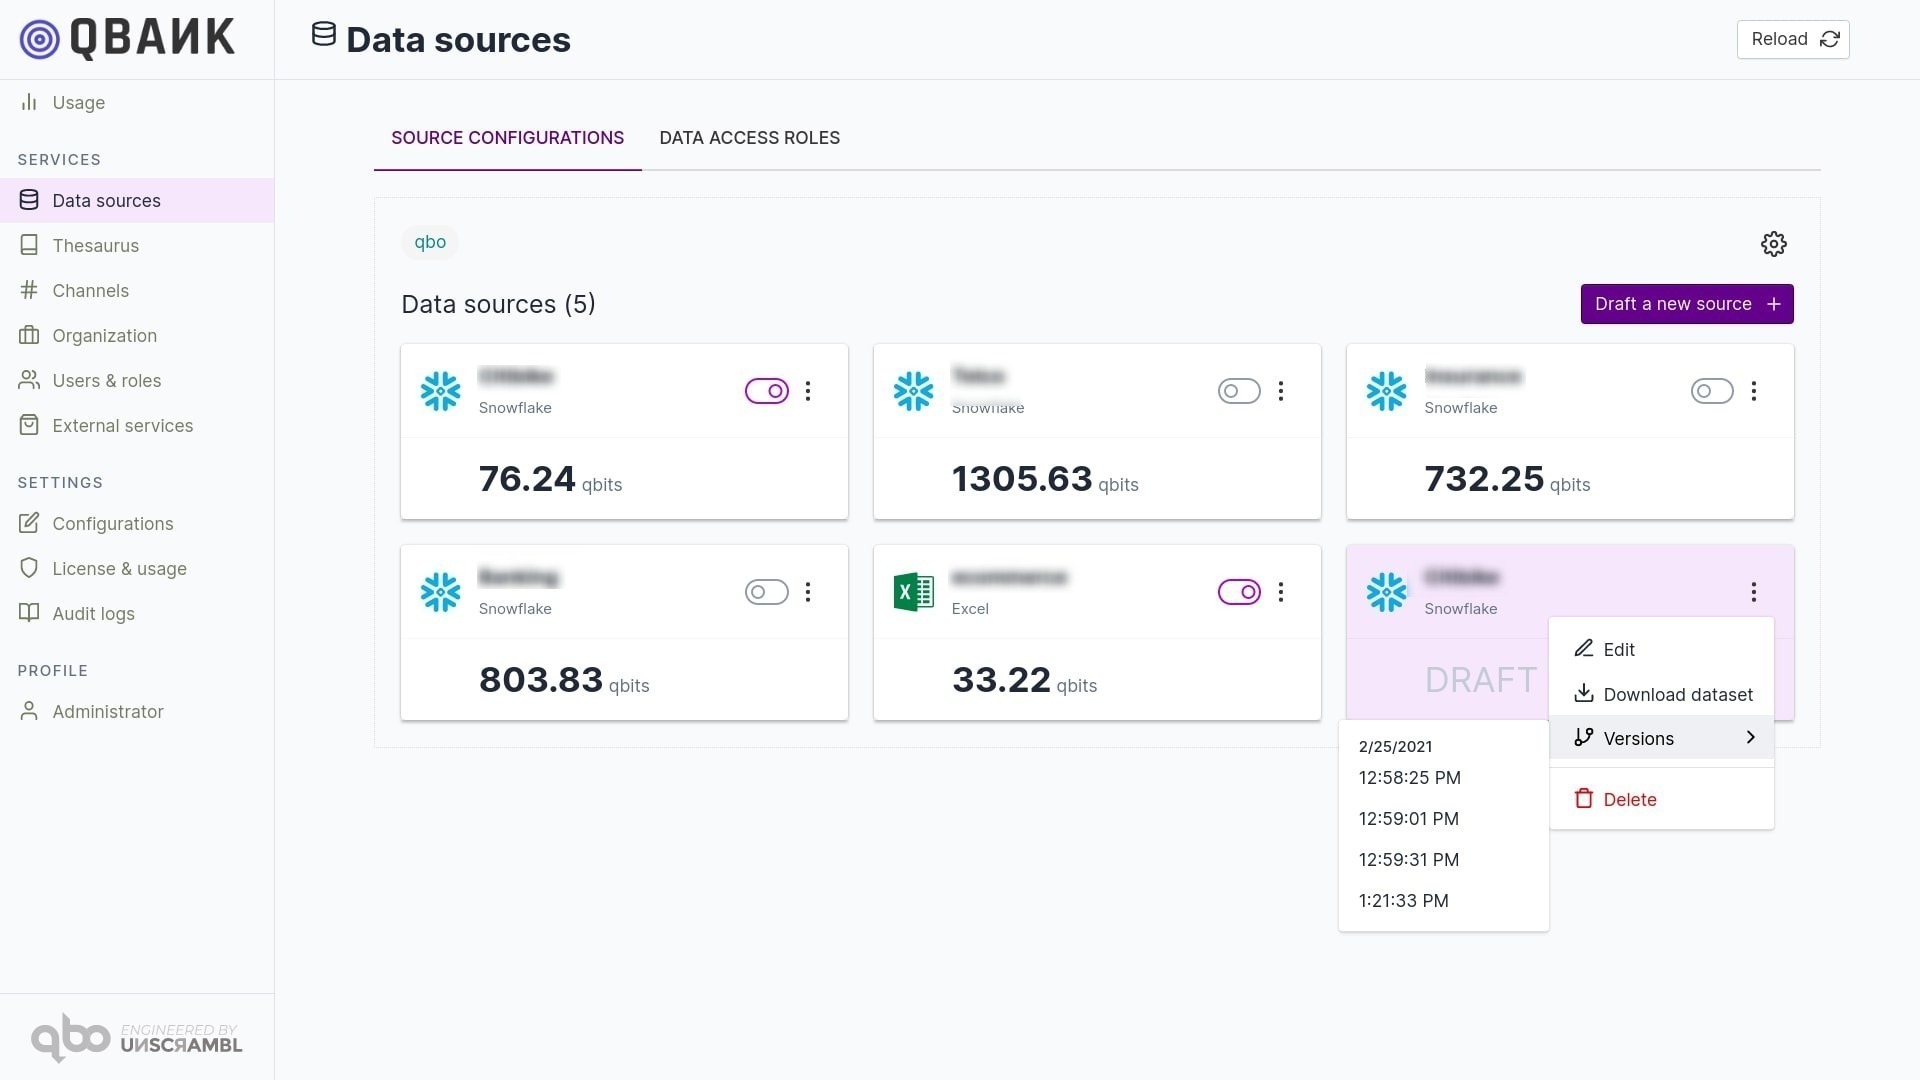
To see the available versions of a draft associated with a data source configuration, click the vertical ellipsis (3 dots).
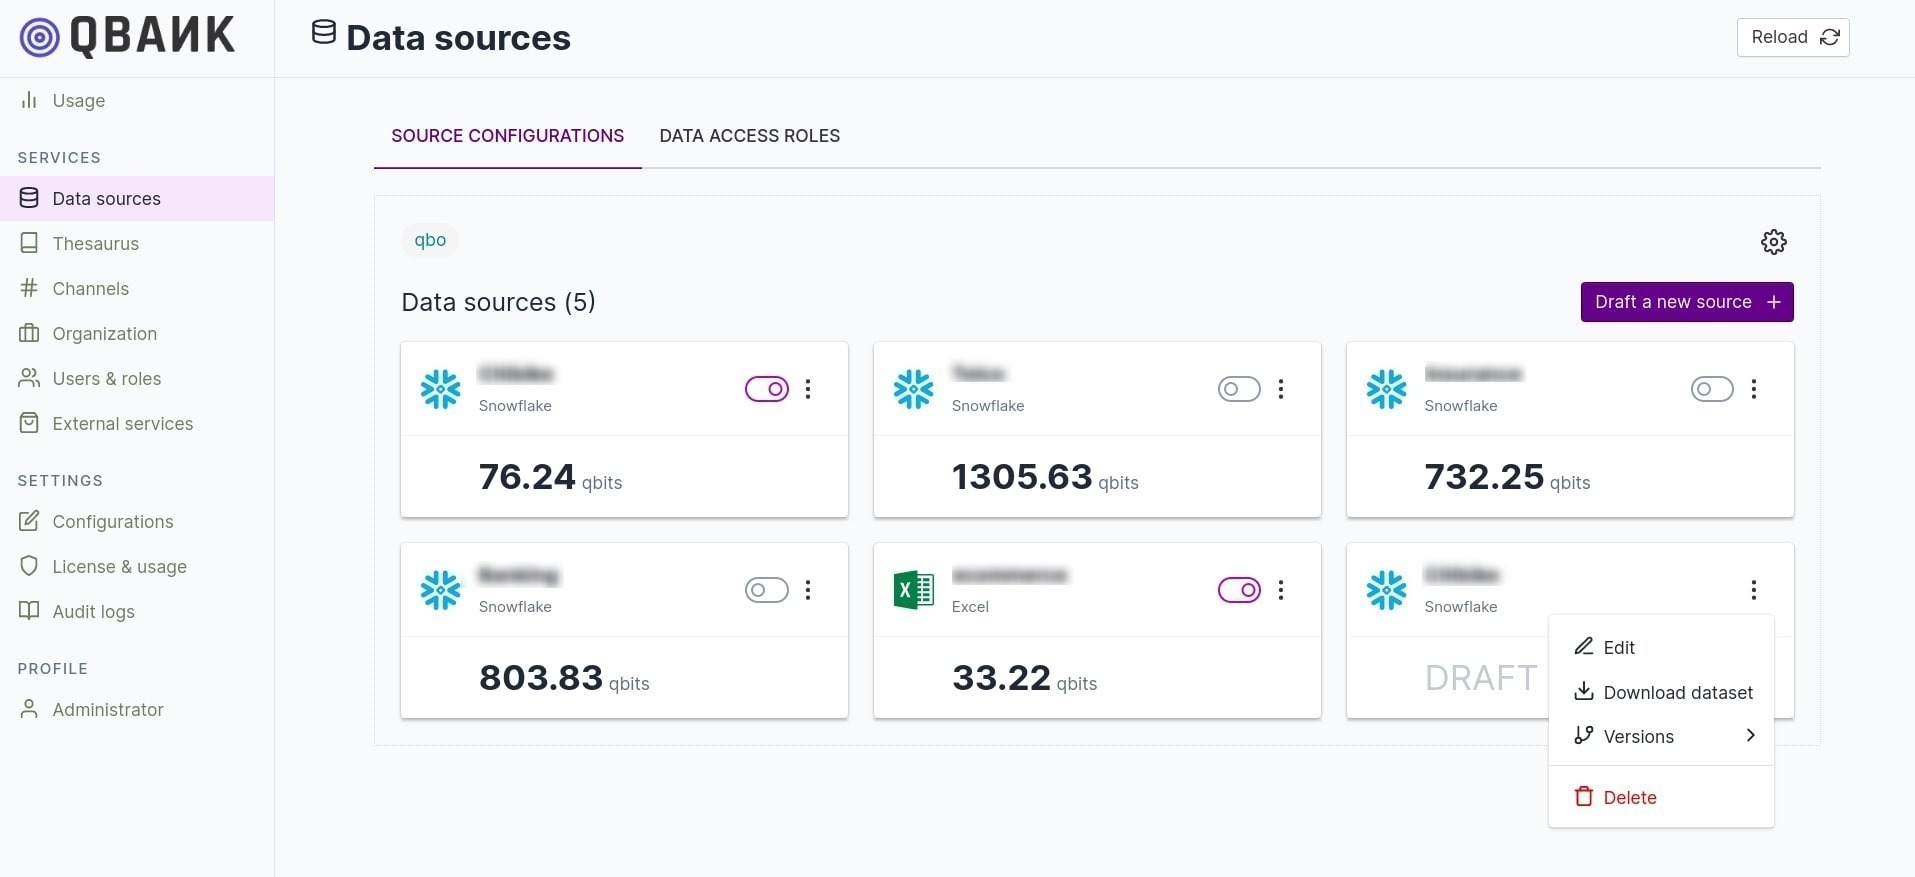
Edit: Edit the draft and make further changes.
Download Dataset: Download a copy of the configuration. This feature comes in handy when you want to retain a local copy of your data source configuration for migration or retention.
Versions: Check the configuration versions available to you. You can store multiple versions of your data source configuration. You can also roll back to previous versions of the data source configuration.
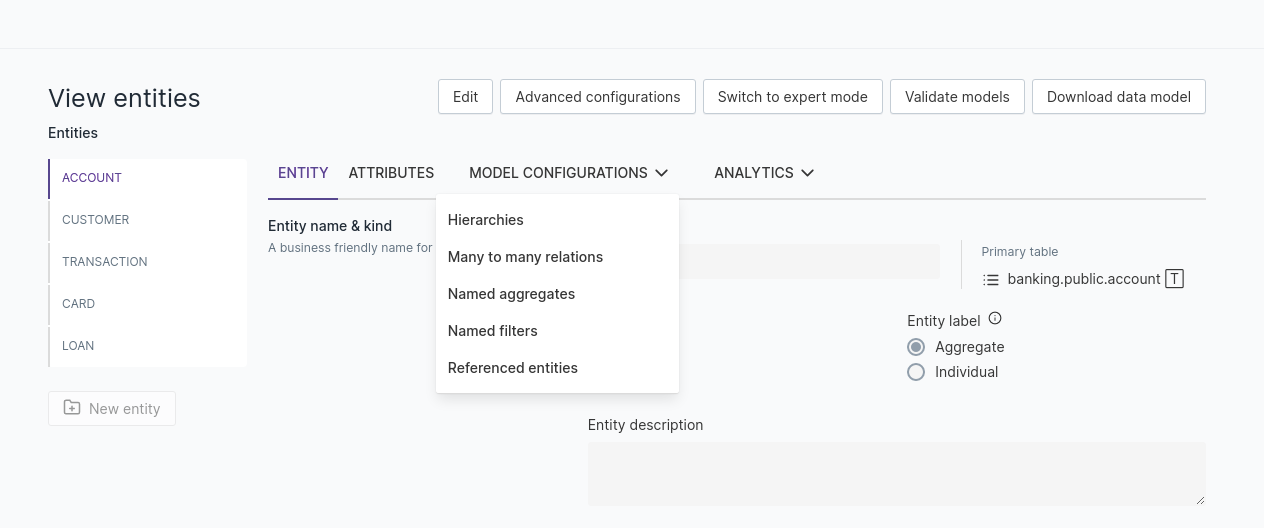
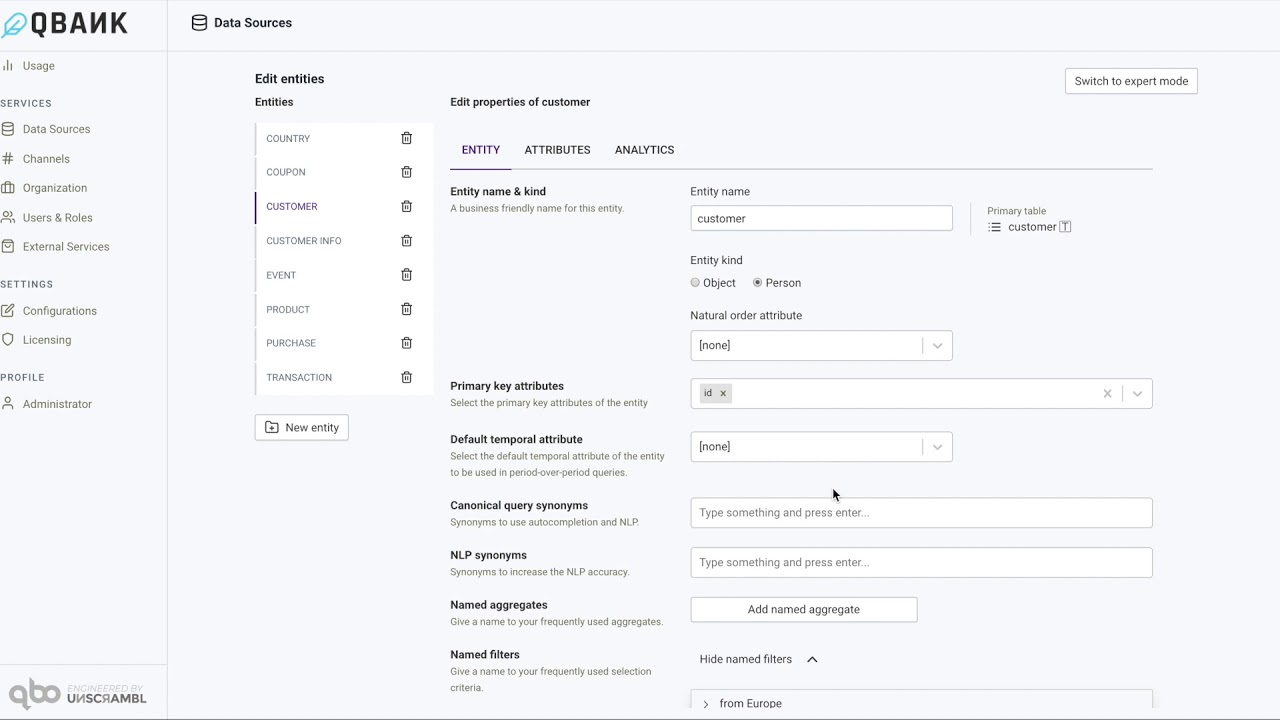
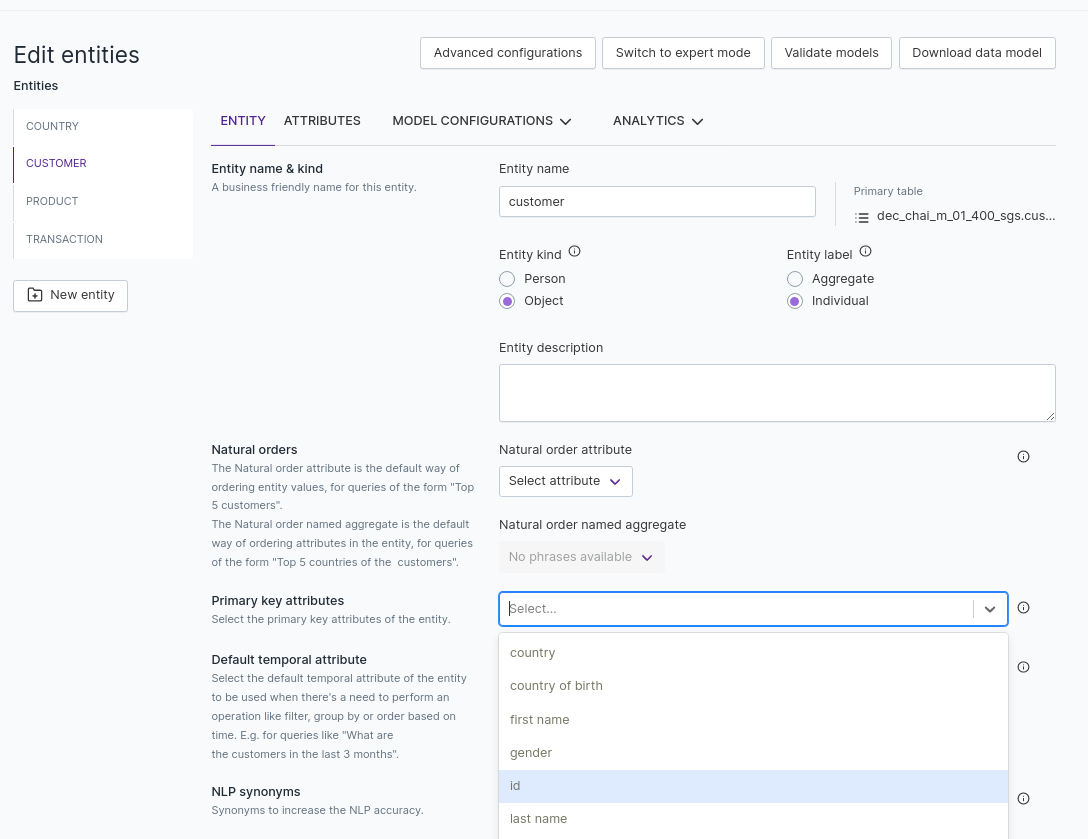
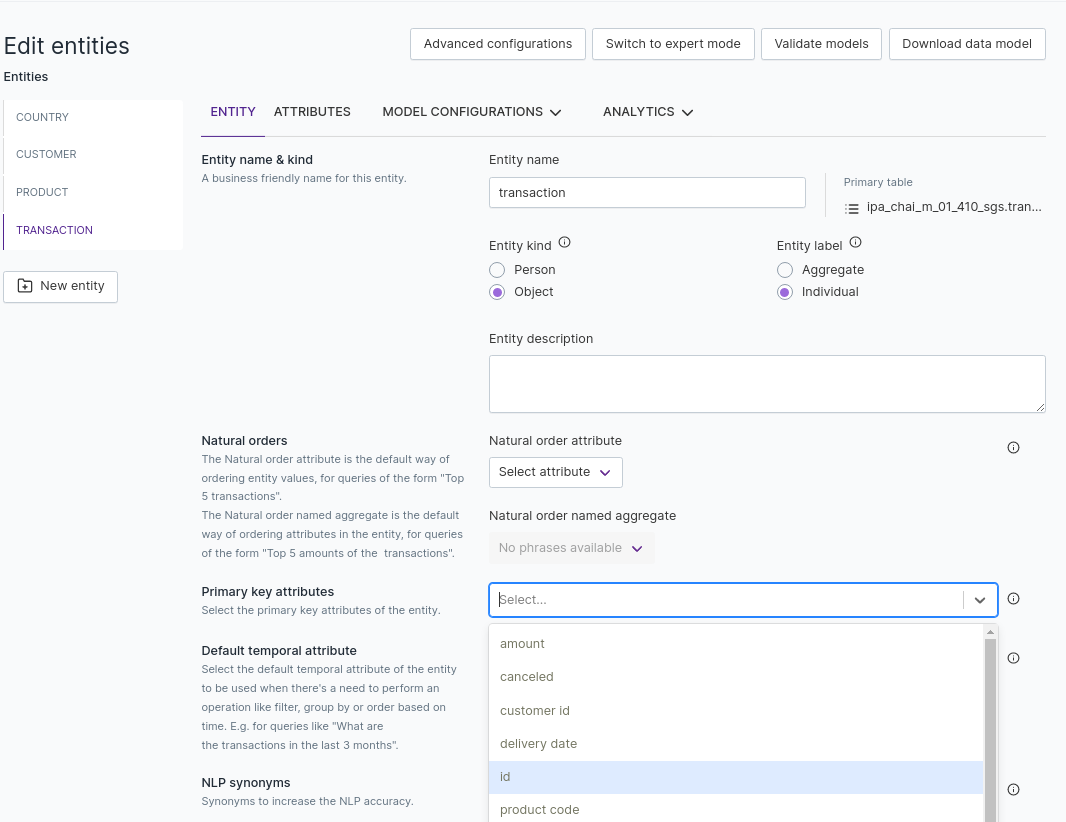
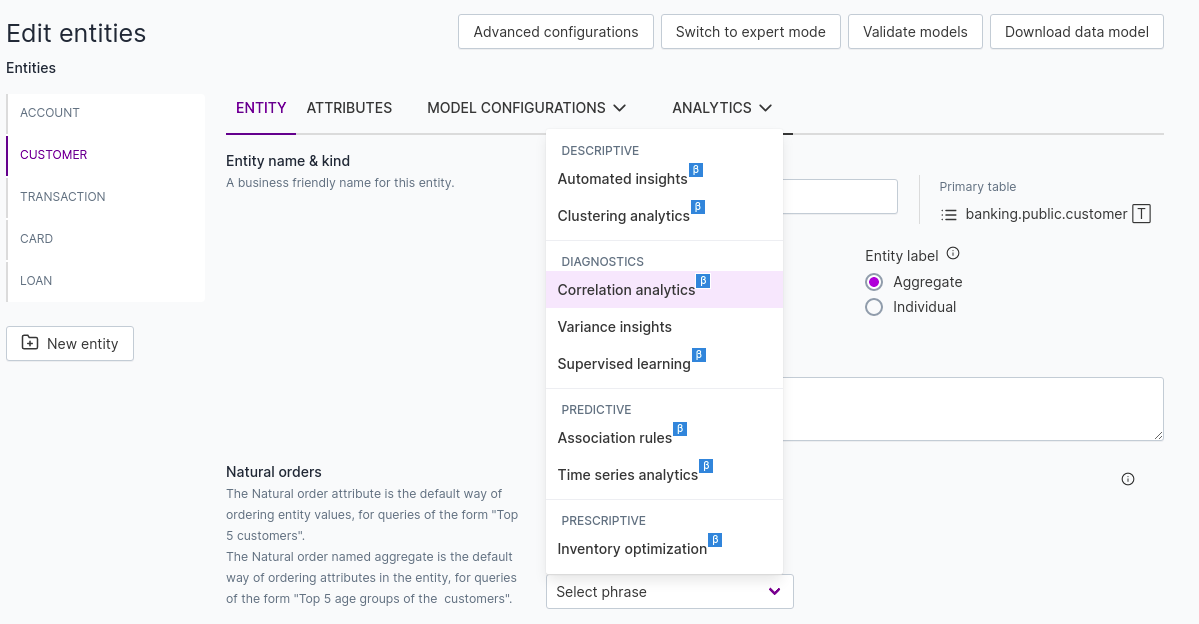
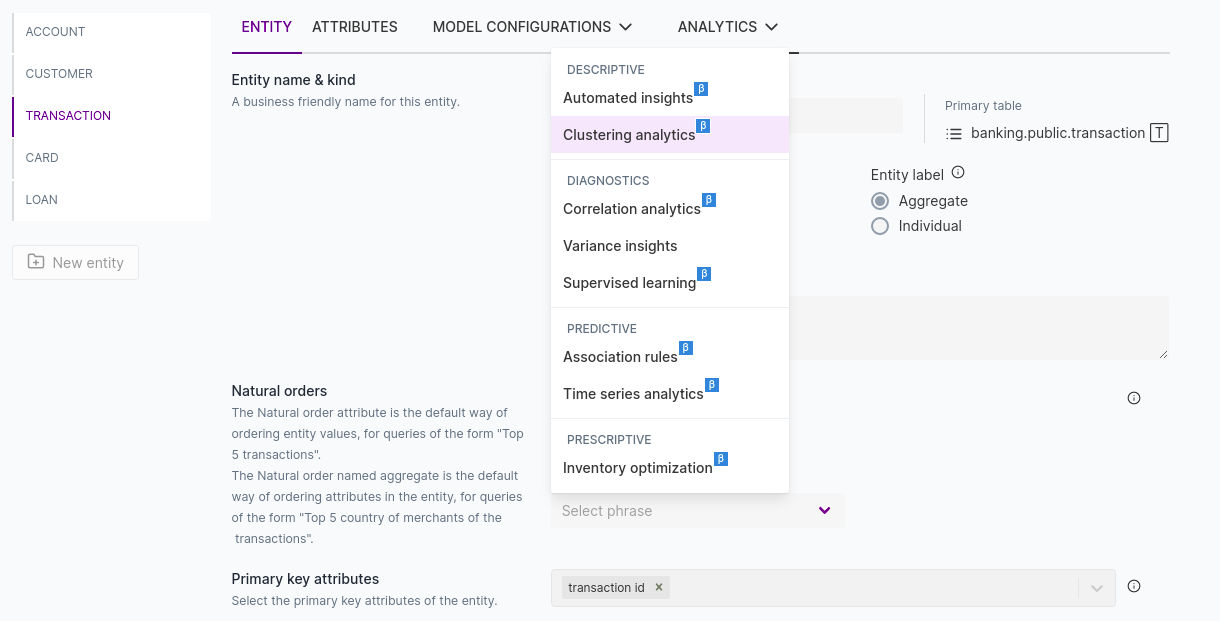
Configure the data model
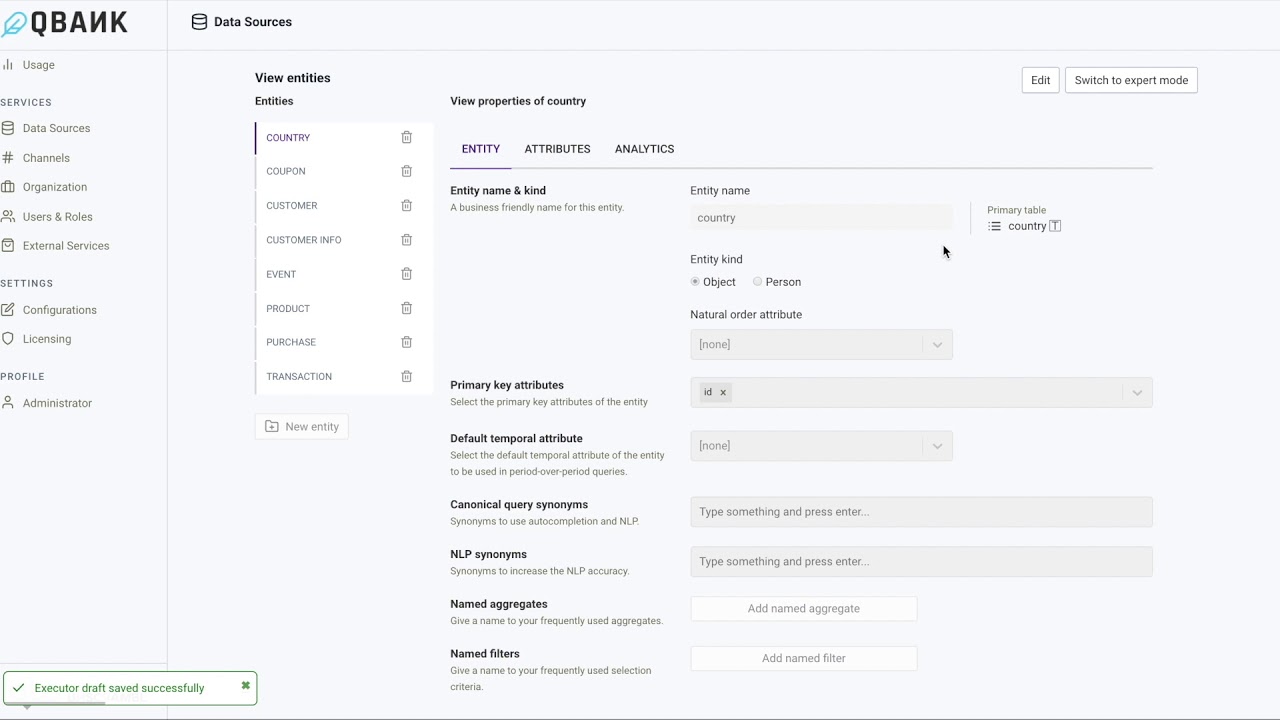
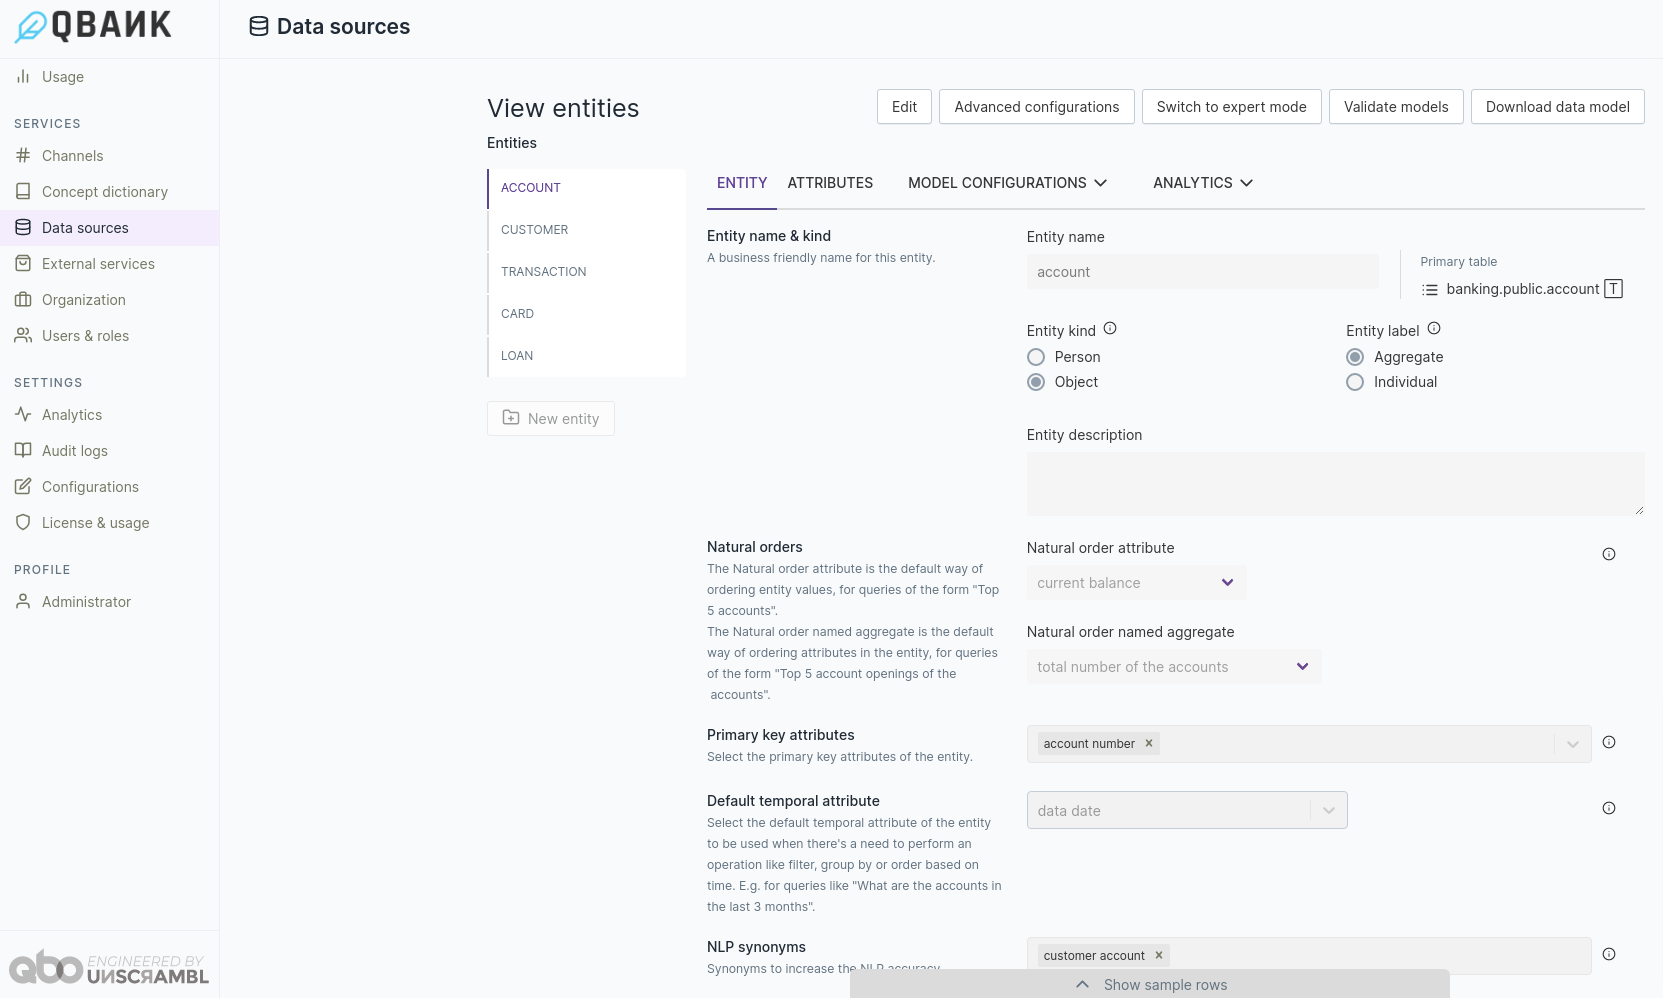
Each table in the data model configuration is treated as an entity. You can edit these entities, specify relationships between them, add or remove attributes, and configure analytics for them.
Select the entity you want to edit from the list on the left. Entity configuration, attributes, and analytics are grouped in tabs at the top of the panel.
Note
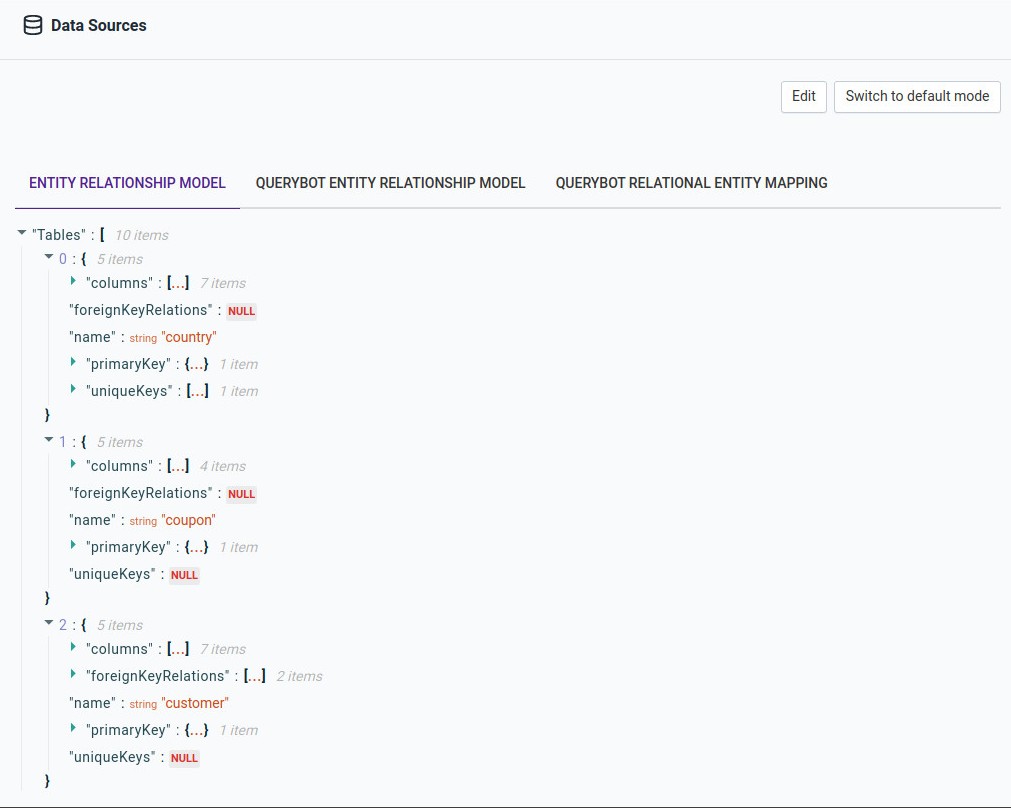
Expert mode allows you to view the JSON format of the data model. Click the Switch to expert mode button to enable it. There are three sections visible, showing entities, attributes and their relations. These 3 are grouped as 3 tabs on the top of the panel, for each entity using three models.
Entity-Relationship Model
Querybot Entity-Relationship Model
Querybot Relational Entity Mapping
Entity configurations
| Configuration | What it does |
|---|---|
| Entity Name | The name used to refer to the entity. If country is the entity name, then the corresponding question that can be answered in guided mode would be: What are the countries? and other variants of the question. |
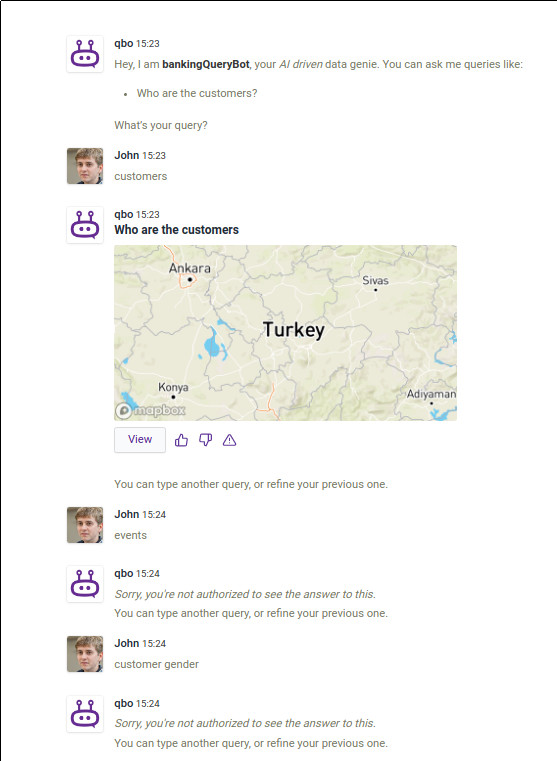
| Entity Kind | An entity can be of type object or type person. You'll typically tag entities that refer to humans - for example, customers - as person entities. When an entity is tagged as a person, Qbo will frame guided questions starting with who instead of what. For example, Who are the customers with a gender of female?. |
| Entity Label | You can train Qbo to improve its overall Natural Language Processing capabilities by labeling entities appropriately. If an entity contains aggregated values - for example, monthly revenues or weekly costs - then you can label it as Aggregate. |
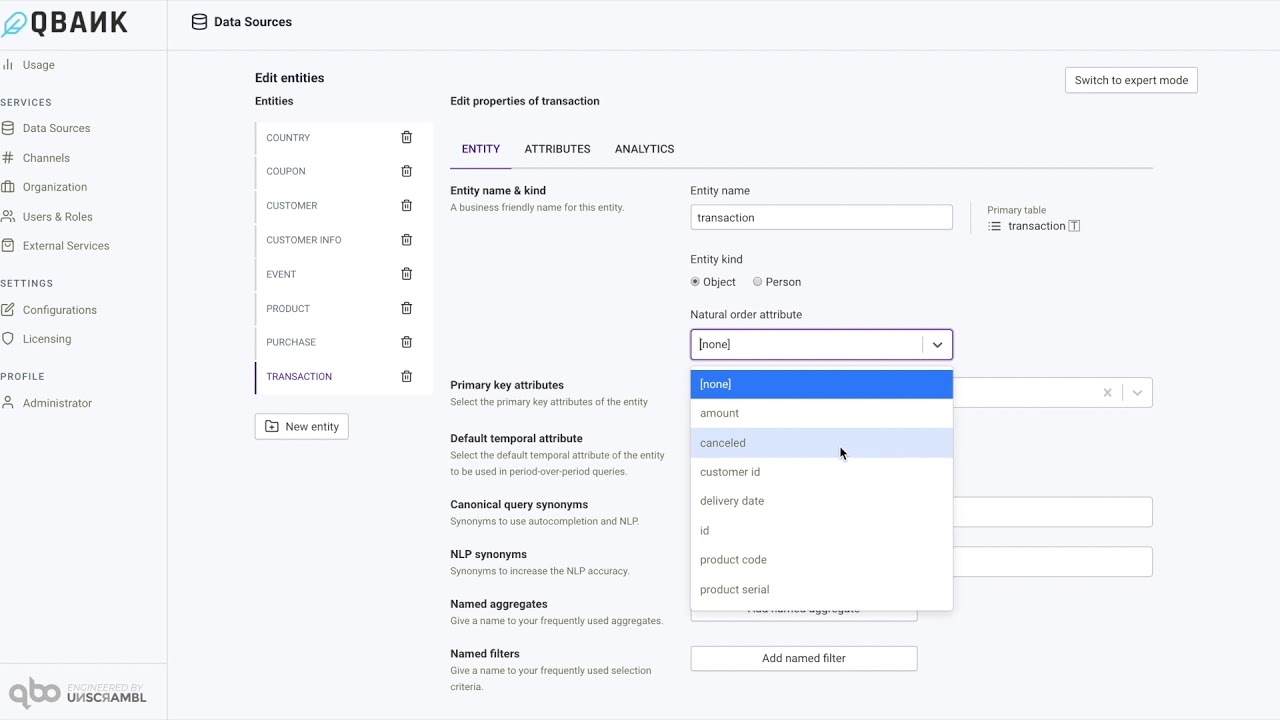
| Natural Order Attribute | Controls the default sort ordering when multiple entities are listed in response to a question. For example, if last name of a customer is selected as the natural order attribute, then the output of a question like Who are our customers? would be sorted alphabetically by last name. |
| Primary Key Attributes | One or more attributes of the entity that uniquely identify the entity. This is a required selection and each entity instance should be uniquely identifiable using the primary key attributes. If a database schema has primary keys already specified, these would be configured as the default primary key attributes. |
| Default Temporal Attribute | Attributes of the Date or Datetime type can be configured as the default temporal attribute. This attribute is used for trend questions and to answer questions like What is the total revenue in the last 3 months? |
| Synonyms | A set of alternative names for the entity. For example, a customer might also be called a client or subscriber. This enables alternative questions like Who are the clients with a salary greater than 100000? or Who are our customers?, where client and customer refer to the same entity. |
| Composite Date Attributes | If the database table does not have a date attribute, but instead has day, month and year attributes, you can create a virtual date attribute. You can then set alternative names for the entity. |
| Named Filters | Named filters help you incorporate business terms into the bot's vocabulary. Examples include terms like Singaporean and French being used to refer to customers from certain countries, or high earners defined as a condition of customer income. |
| Named Aggregates | Business teams often have a well-defined set of terms that they use to refer to summations, averages and conditions. For example, net profit, gross margin, or revenue. Qbo allows typical aggregates like count, sum, minimum, maximum, average, standard deviation, and distinct count, along with filter conditions. |
| Referenced Entities | If you define reference relations in your QueryBot entity relationship model, you can generate referenced entity filters in queries. These reference relations are created by default, based on foreign key relationships when you use the QueryBot tooling to create the initial version of the QueryBot entity relationship model. For example, transactions referencing customers are M-1 relationships - multiple transactions can have the same customer. In this scenario, each transaction references a customer. The customer is the referenced entity and the the transaction is the referencing entity |
| Derived Attribute | Derived attributes are made up of other attributes. They do not actually exist in the database schema. They are calculated on the fly and presented as regular attributes. |
| Variance Analysis (Analytics) | Variance analysis is a quantitative investigation of the difference between actual and planned behavior. This includes investigation of the factors that contribute to this difference. The goal is to identify factors responsible for the difference and take action based on this information. For example, you perform variance analysis of credit card usage or **sale/revenue** for the quarter, considering factors like location, merchant, plan, and type. If you identify a decrease in a particular location or with a particular merchant, your business can act on that information. |
NLP Synonyms
Qbo uses the NLP model to understand user queries with no prior training, data preparation or human-driven model building. A set of NLP alternative names for entities is used to enhance natural language queries experience. For example, a customer might also be called a subscriber. This assists NLP queries enabling alternative questions like Subscriber with salary greater than 100000? or Subscriber?, where subscriber refers to the Customer entity.
Composite date attributes
Composite attributes combine multiple database fields into one. For example, combining day, month, and year fields
into a single date composite attribute. This can help facilitate queries that involve temporal analysis.
In the data set shown below, the entity entity contains fields for day, month, and year,
which can be combined to create the time attribute, which will be the composite date.
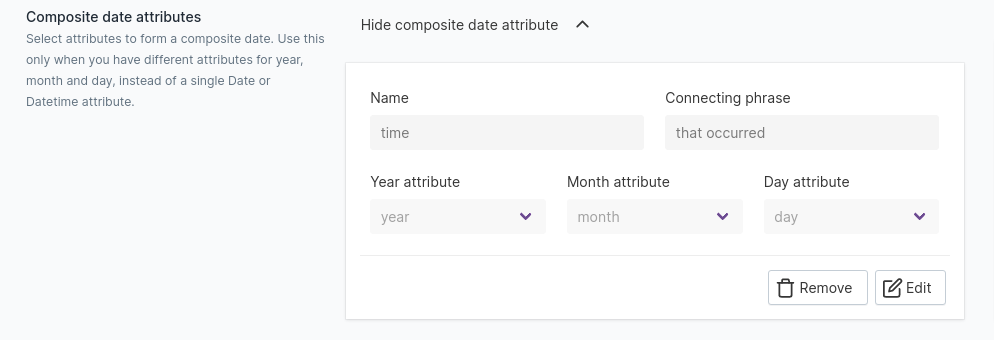
This enables users to ask questions like:
What are the events that occurred after 2019-04-27?What are the events that occurred on or after 2019-04-27?What are the events that occurred before 2019-04-26?What are the events that occurred on or before 2019-04-26?
Model configurations
Entity configurations such as Hierarchies, Many to many relations, Named aggregates, Named filters, and Referenced entities are present under Model configurations.
Named filters
You can use named filters to incorporate business terms into the bot vocabulary.
Named filters are very useful in profile tables. For example, we can define named filters like Singaporean, defined as a customer with nationality Singapore; or woman, defined as a customer with gender Female; or equity, defined as an asset with category equity.
Define named filters in singular form. Qbo automatically uses the plural form as needed.
A number of filter types are available when configuring a named filter:
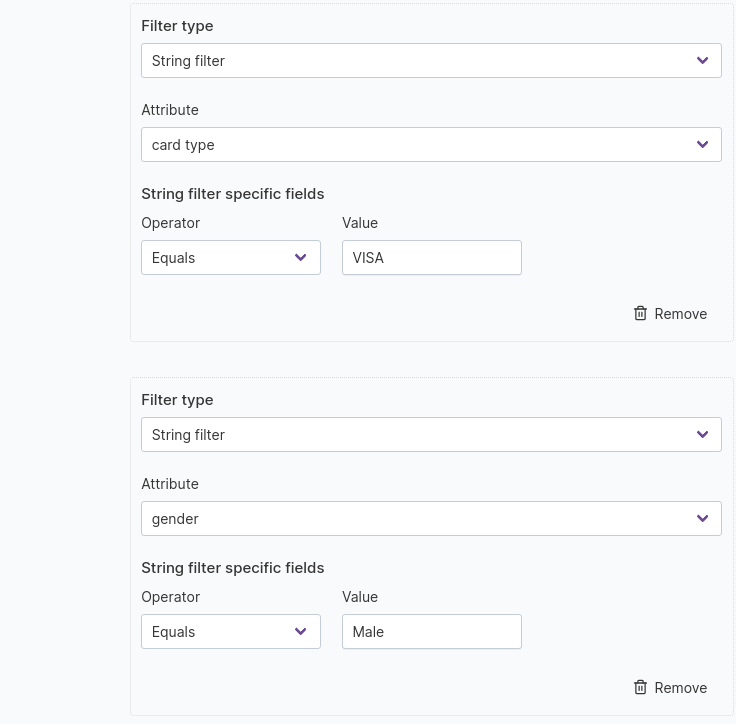
String filter
Filters out certain values of an attribute of type String.
For example, a String filter of customer entity.
Related Videos
Create a named filter in Qbo
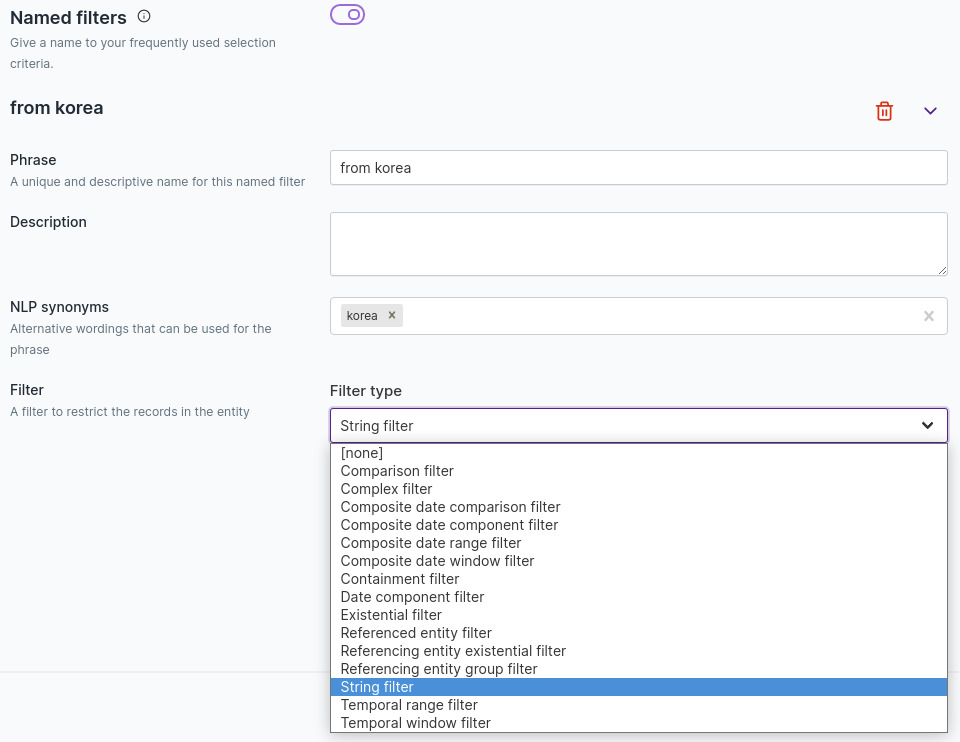
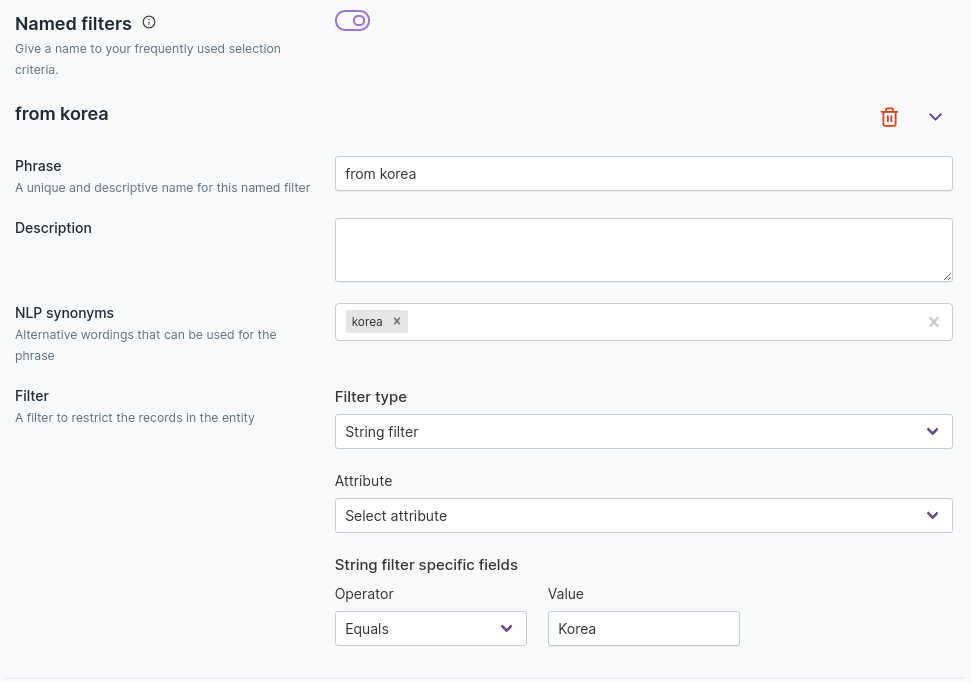
Who are the customers from Korea?Comparison filter
This is used to make a comparison while filtering out certain values of an attribute. For example, filter out
values of amount greater than 10000. Other available operators are Equal, Greater than,
Greater than or equal,``Less than``, Less than or equal, and Not equal.
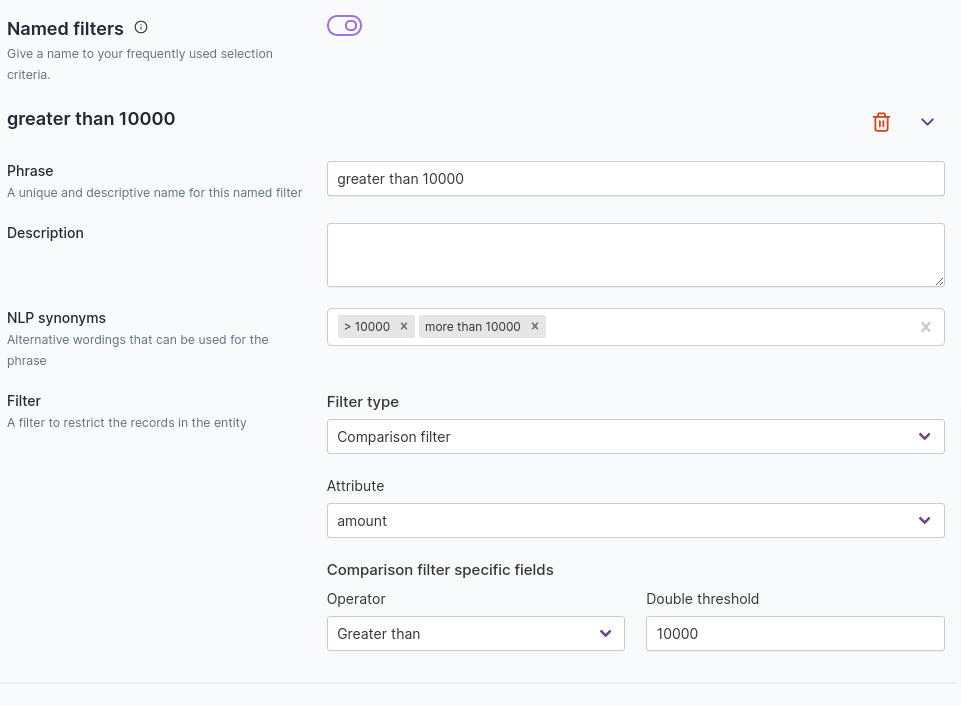
Who are the customers having an amount greater than 10000Complex filter
This is used to combine multiple filters with a connective. The connective can be And or Or.
For example, you can combine two string filters into one complex filter.
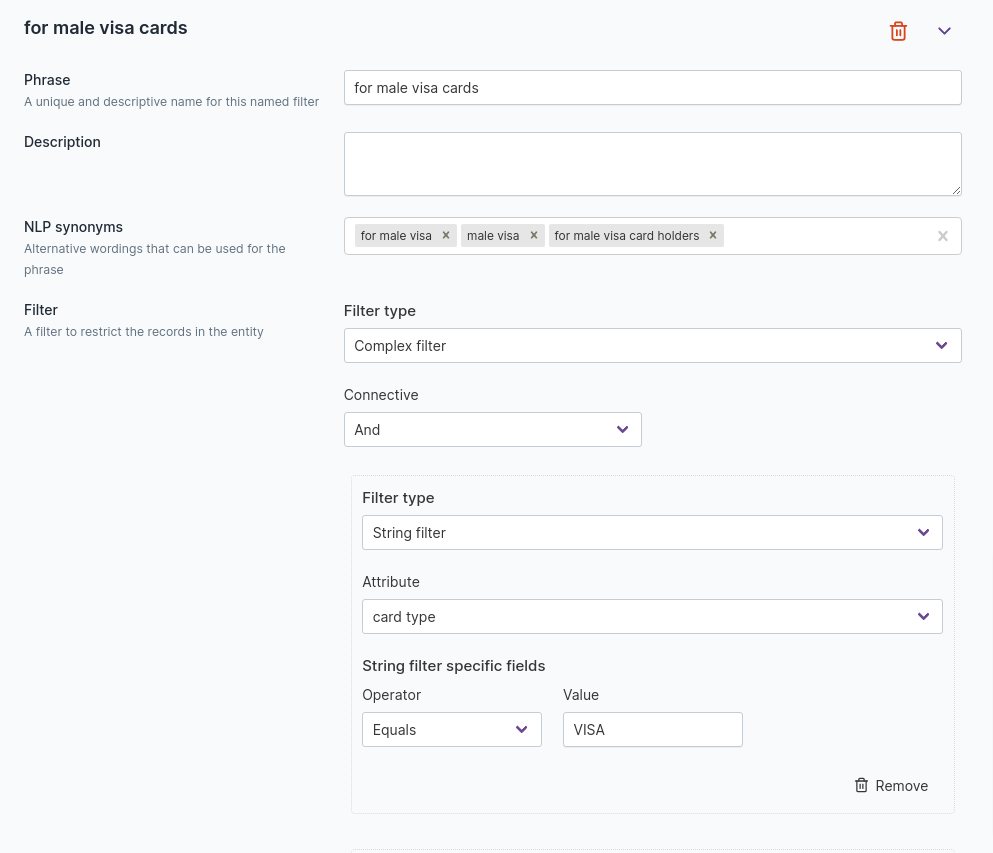
Total transactions for males using Visa cardsComposite date comparison filter
You can use composite date comparison filters on composite date attributes, whose day, month and year attributes are mapped to different columns of the corresponding table. For example, if the date, month and year are all provided as separate attributes and we want to filter out values for date greater than Dec 2019, we can make use of this kind of filter.
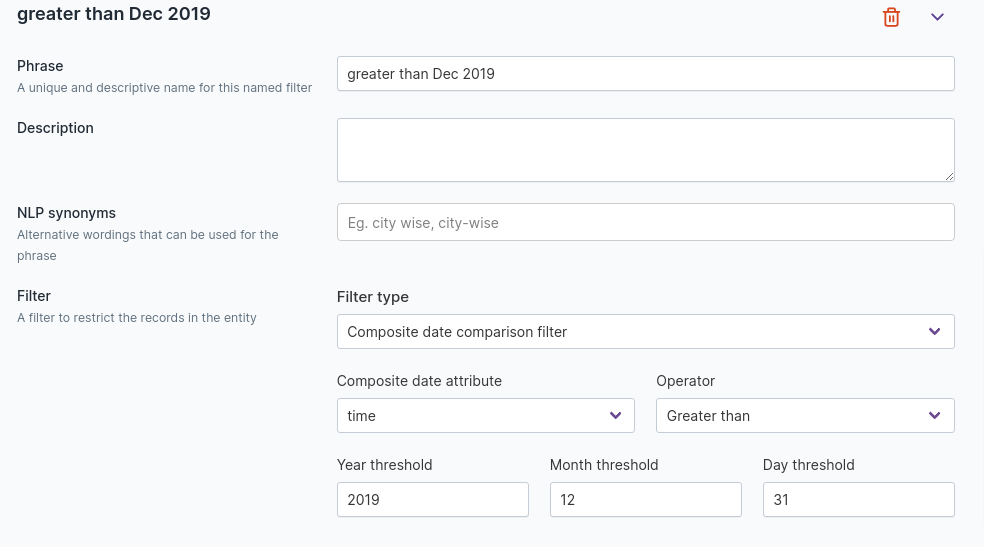
Total spending for date greater than Dec 2019Composite date component filter
Date and datetime values have more than one component. You can create individual filters for any of these.
Available time units are Day, Hour, Minute, Month, Quarter, Week, and Year.
For example, to get data from April, we can use the filter as shown in the example.
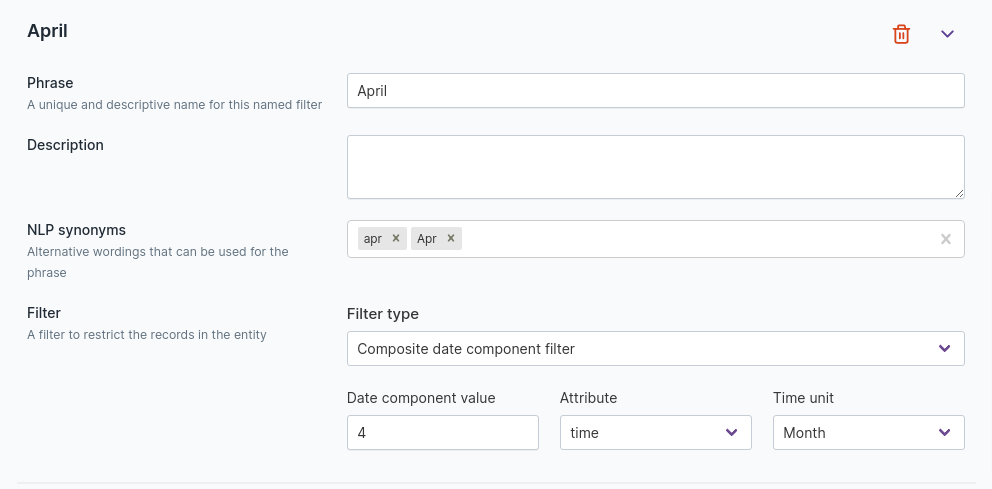
Total spending in AprilContainment filter
For attributes of string type, you can set a list of values and filter out data with values that aren’t in the list. This is called a containment filter. For example, you can filter data from a continent of Africa, Asia, or Europe.
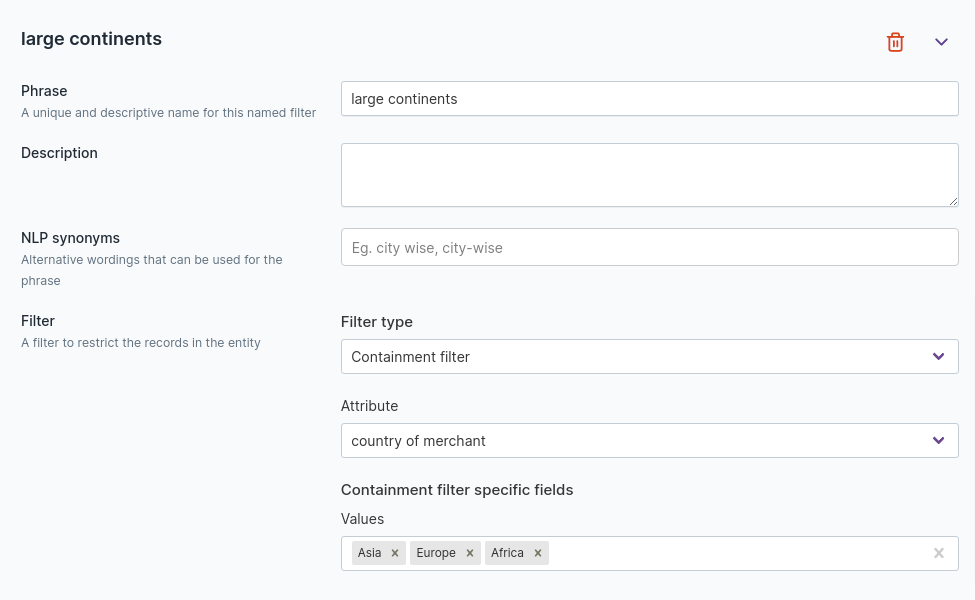
Total spending in large continentsComposite date range filter
You can employ composite date range filters on composite date attributes with day, month, and year attributes mapped to different columns of a table. Composite date range filters allow you to set a date range with start and end date. This is displayed on three different attributes of the entity.
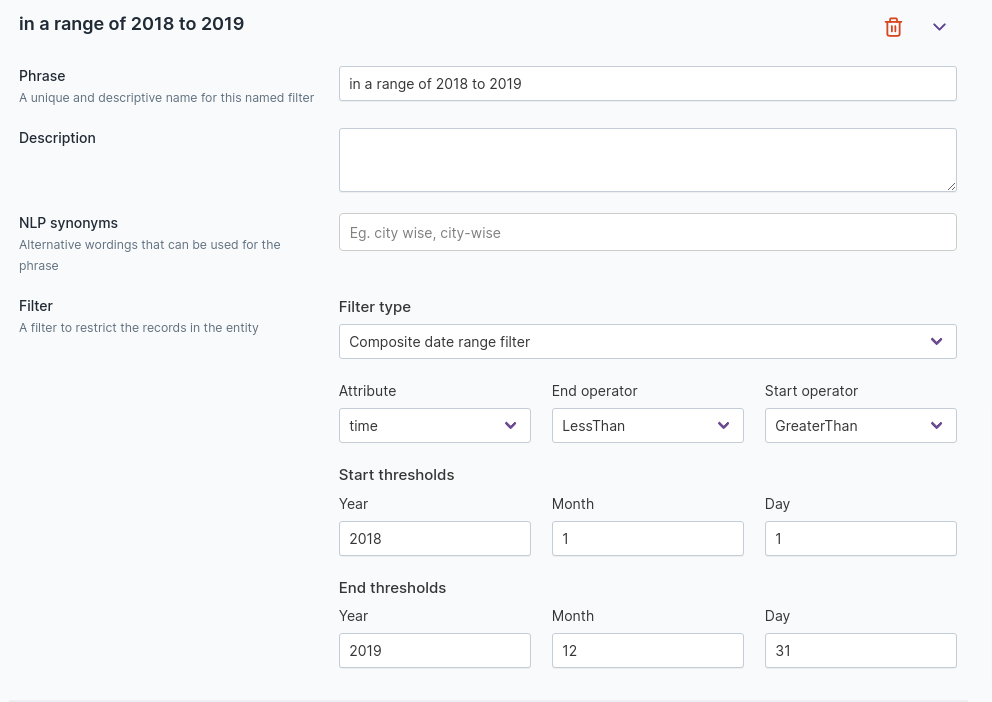
Total transactions in range of 2018 to 2019Composite date window filter
Window filters are rolling windows, with no absolute date information included. For example, phrases like last
month and last 3 weeks use window filters. If these queries are performed on composite date entities, they
become composite date window filters. For example:
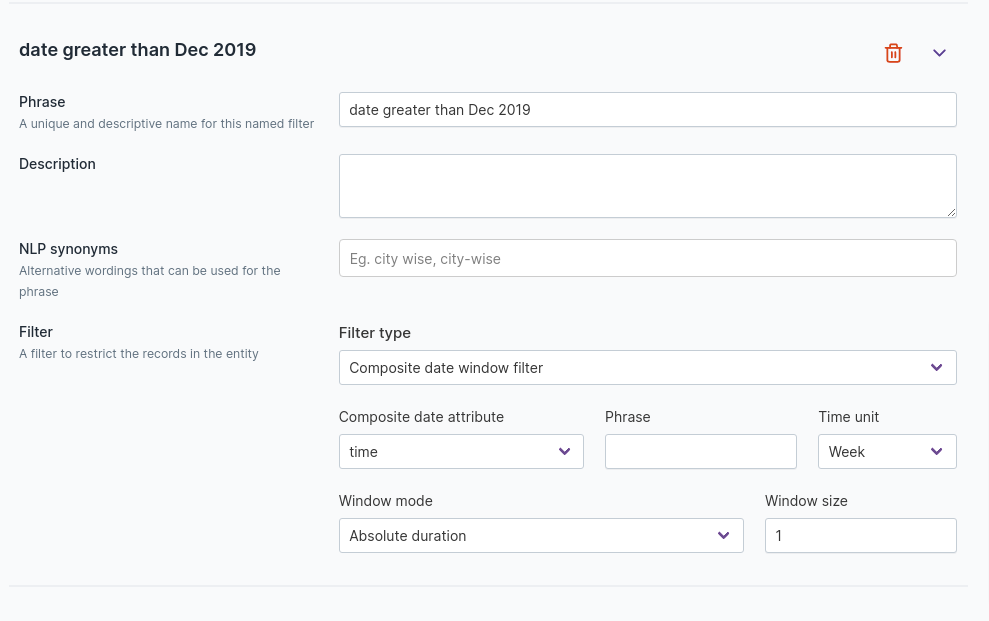
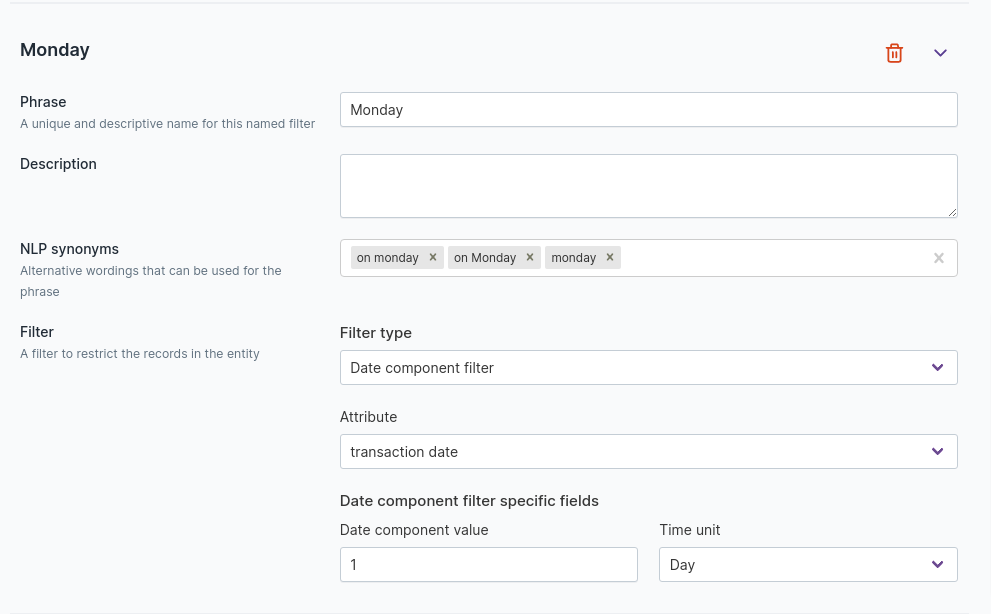
Total spending for date greater than Dec 2019Date component filter
Date component filters query using a component like DayOfWeek, MonthOfYear, or Year. When you want to query the
entity that happened on a Monday, or in January, use a date component filter.
This allows you to create queries like Products that were listed on a Monday.
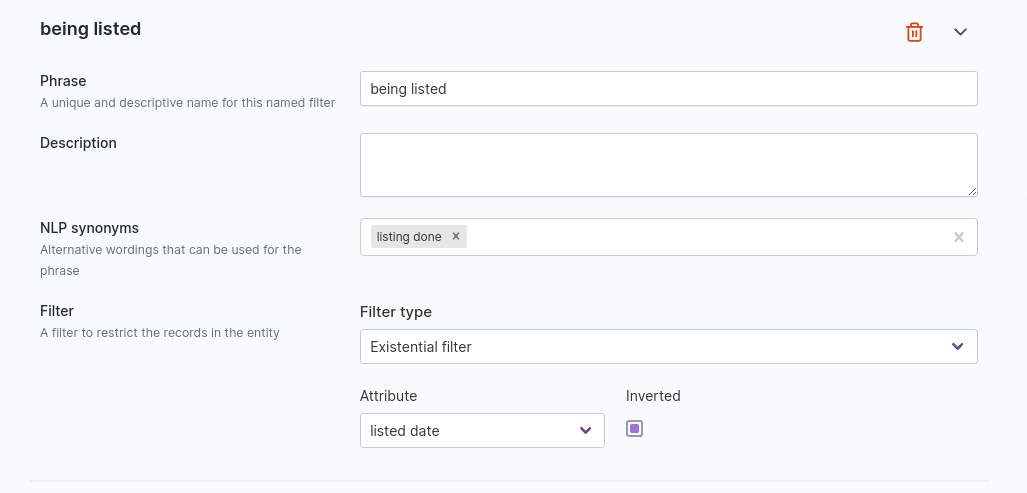
Existential filter
This filters data by whether a specified attribute value is set to NULL. When the inverted checkbox is selected, only the data where the specified attribute is set to NULL will be used. When inverted checkbox is not selected, only the data where the specified attribute is set to a value other than NULL will be used. For example, What are the products with a listing date? is an existential query that returns products with listing date attribute set to a value other than NULL; What are the products without a listing date? is an existential query that returns products with listing date attribute set to NULL.
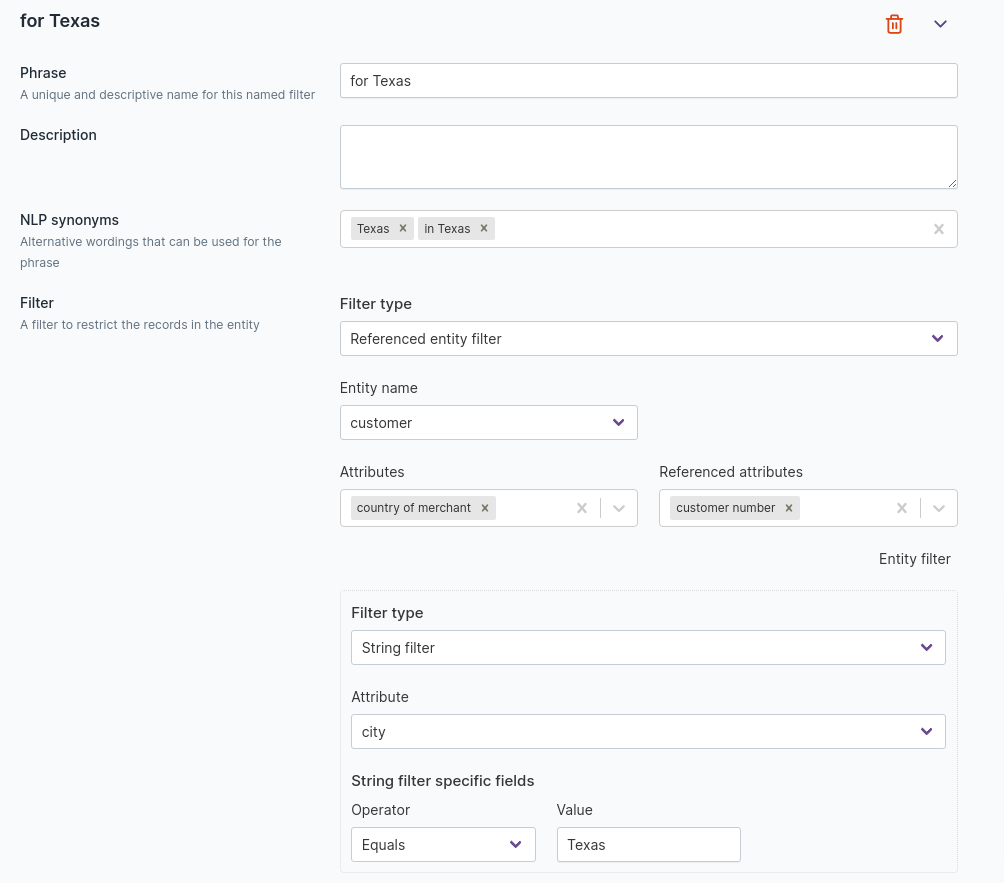
Referenced entity filter
These use a filter on the current entity that runs on the entity referenced by the original entity. For example, you have two entities: customer and transaction. The transaction entity references the customer entity. If you want to know about your Texas customers, you can ask, What are the transactions with customer in Texas? This type of filter needs:
Entity from which you want to reference attributes
Attributes
Referenced attributes
Once these are specified, you can use the type of filter you want to apply on the referenced entity.
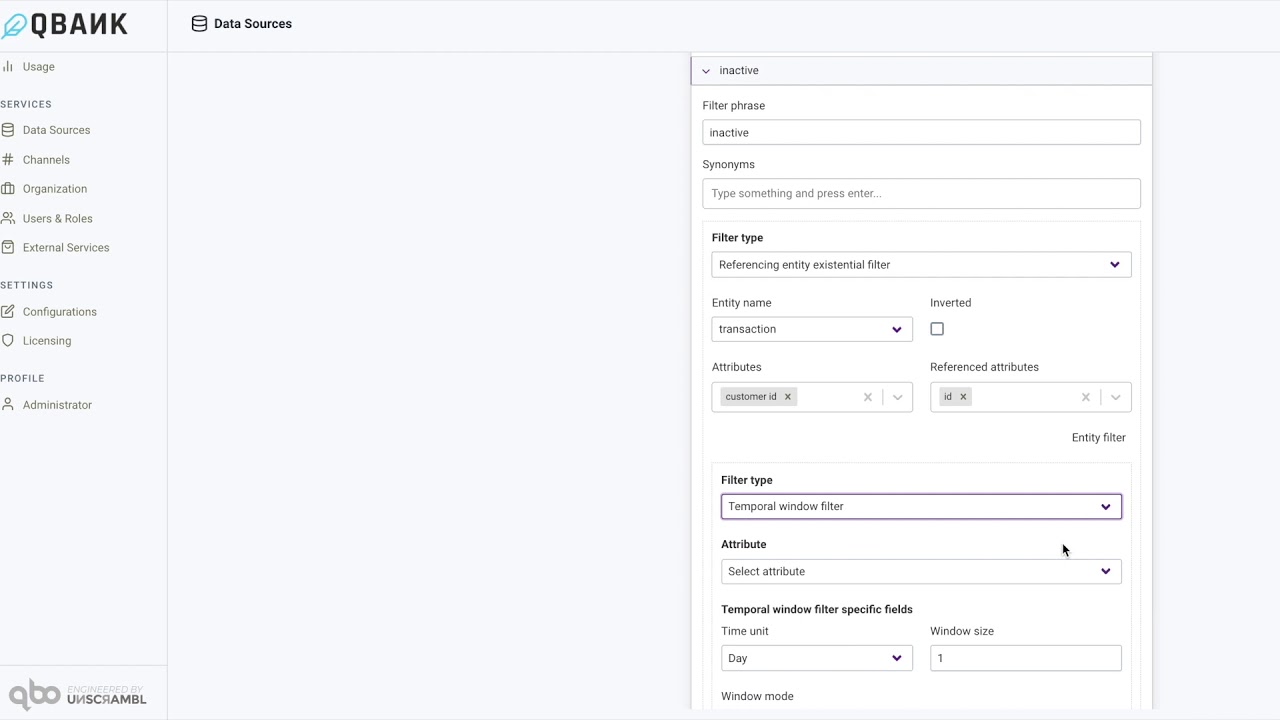
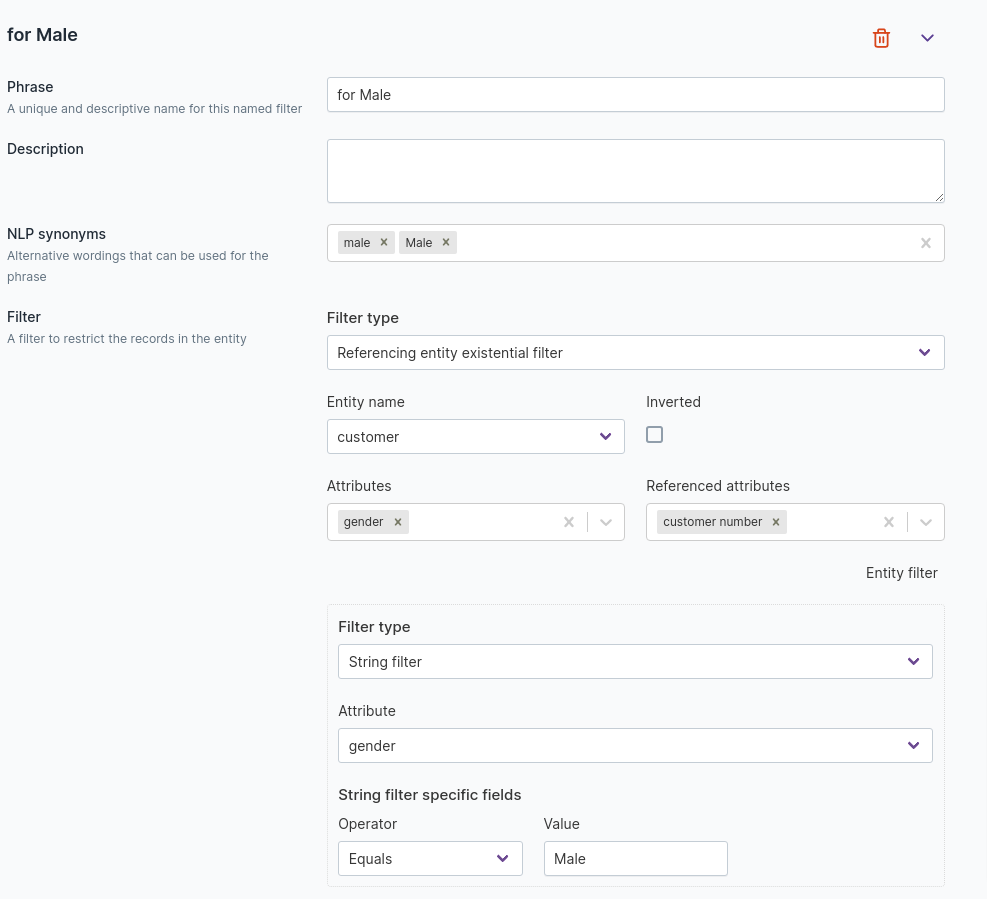
Referencing entity existential filter
Referencing entity existential filters are similar to referenced entity filters, but with the places of the entities switched. For example, you might ask about the country entity using a filter that runs on the customer entity: What are the countries that have customers with a gender of male?. This requires filtering customers by gender and using those customers to filter data in the country entity.
To ask about countries that have no male customers, we can ask, What are the countries that have no customers with a gender of male?. Select the Inverted checkbox to allow this.
This type of filter needs:
Entity from which you want to reference attributes
Attributes
Referencing attributes
Once these are specified, you can use the type of filter you want to apply on the referenced entity.
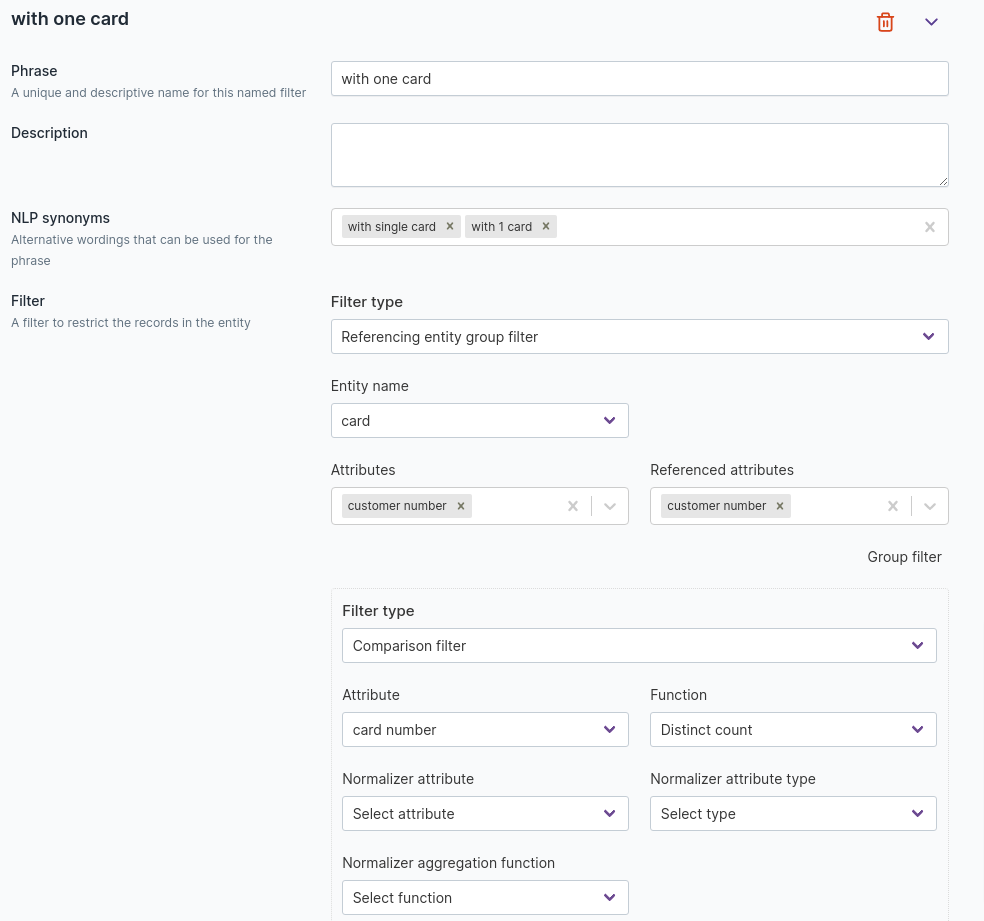
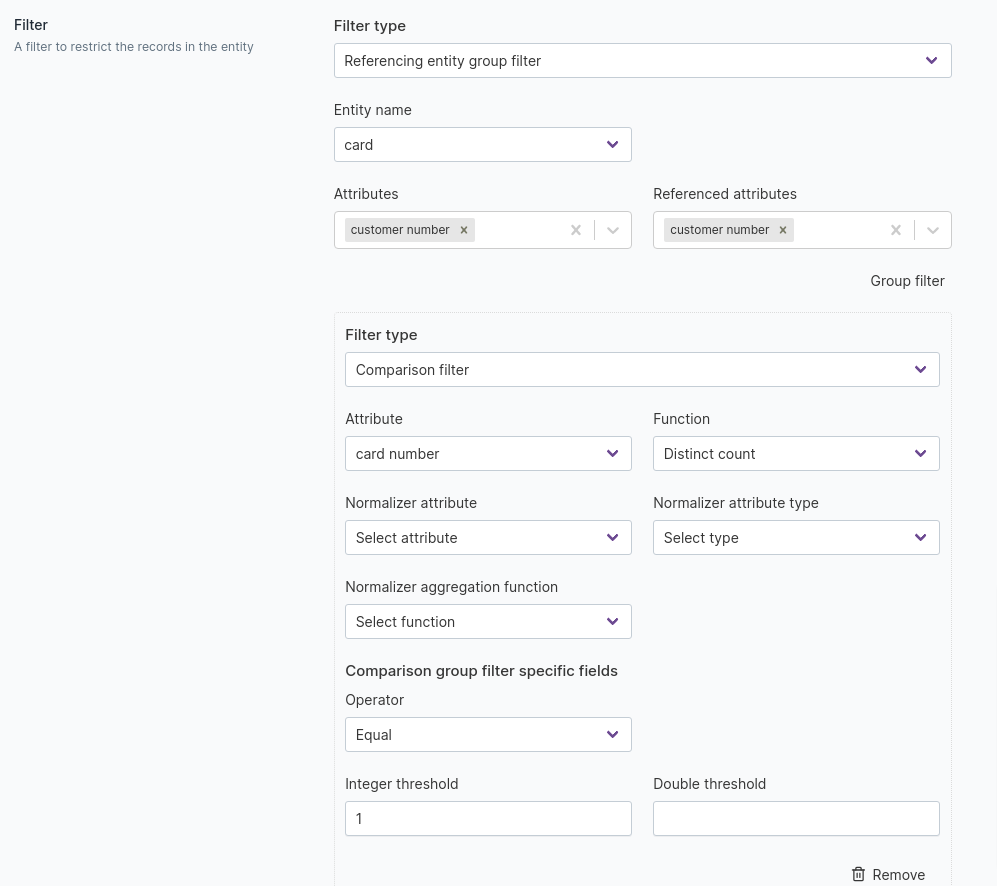
Referencing entity group filter
These filter data of the current entity using a filter that runs on an aggregated attribute of the entity that references it. You can set grouping filters on entities which reference other entities, so that you get the queried referencing entities. For example: Who are the customers with the total amount of transactions greater than 150, that occurred in the last 20 days? Each transaction is associated with a customer, so in this case, the transaction is the referencing entity and the customer is the referenced one. There will be a group filter on the transaction amount and there will also be a simple filter regarding time attribute of transaction.
You can ask questions like, What are the countries with the total number of resident customers greater than 100? To get an answer, the query will filter country entity here by using a filter that filters the customer entity but the filter is applied to an aggregated attribute which is the count of the rows.
Temporal range filter
This is analogous to the Composite date range filter, but these run on the datetime field already present in your
database.
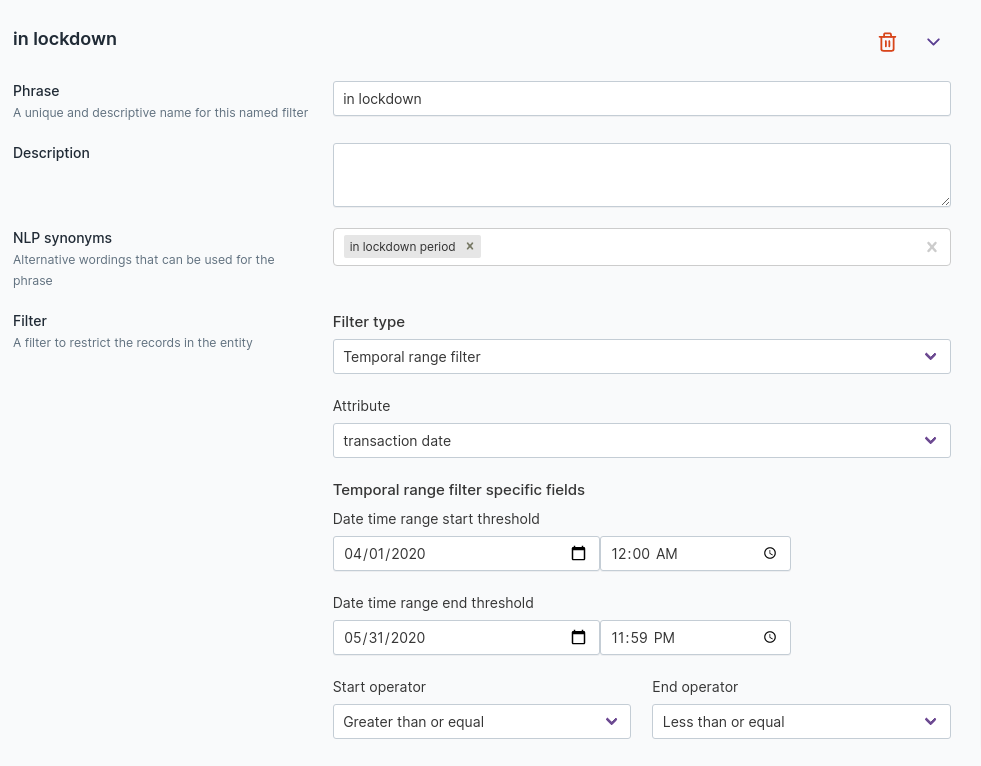
Total spending in lockdownTemporal window filter
This is analogous to the Composite date window filter, but these run on the datetime field already present in your
database.
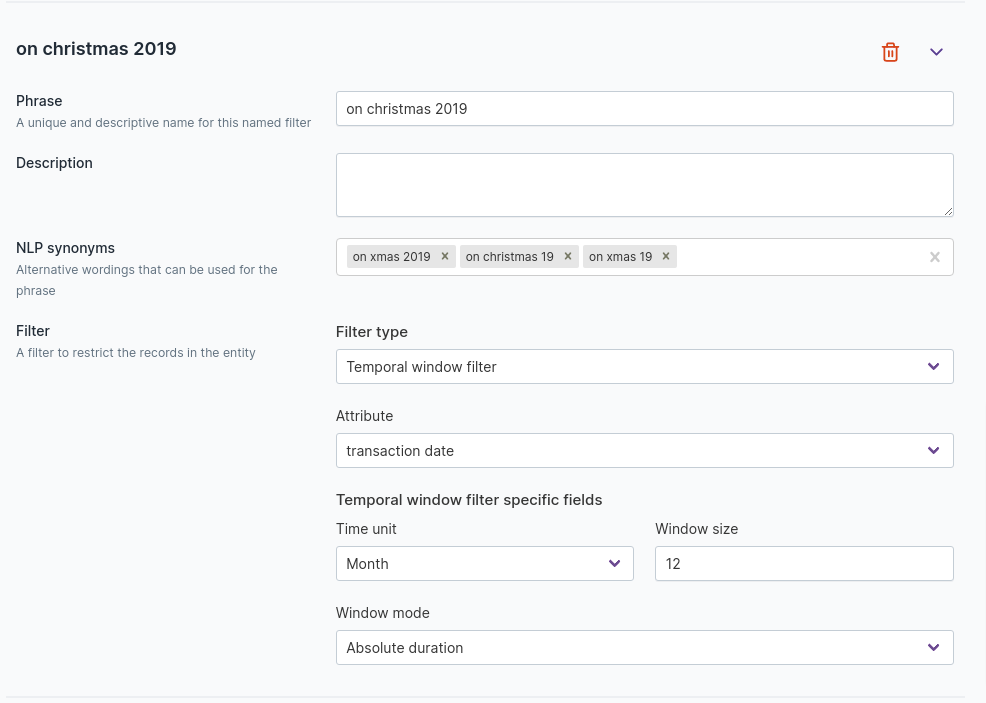
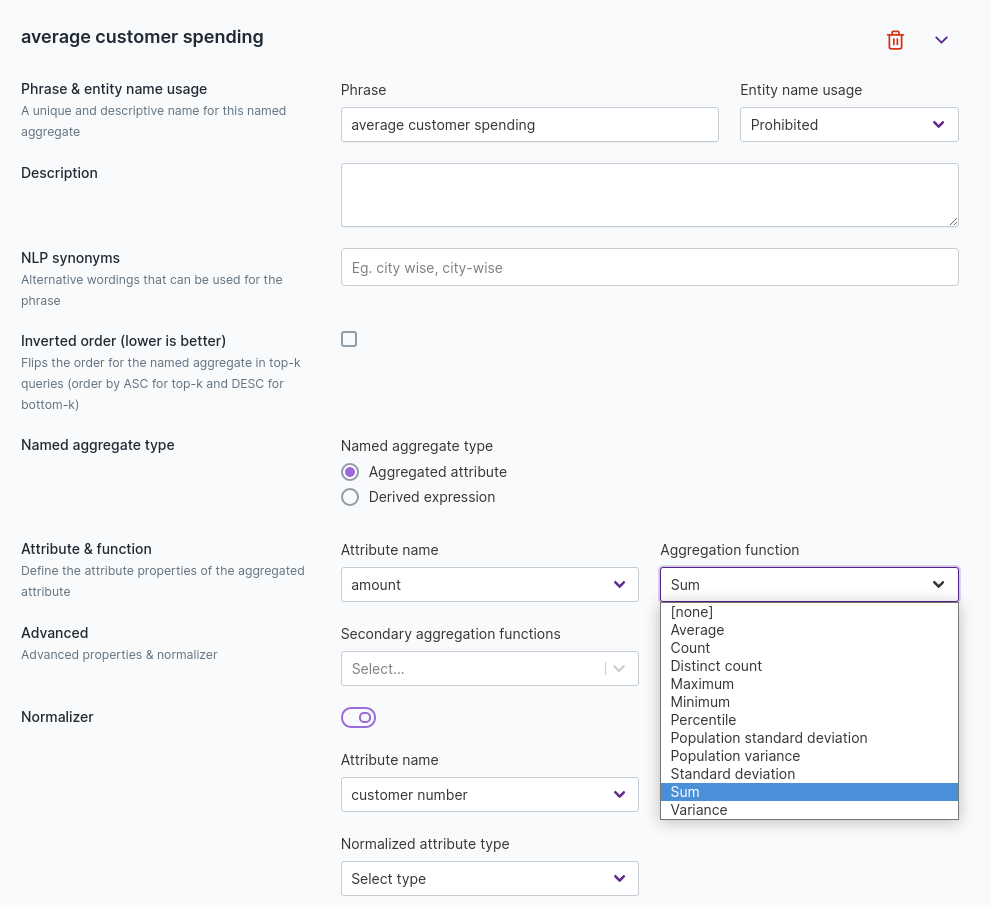
Total spending on Christmas 2019Named aggregates
A named aggregate is a single summary value that is formed from mathematical functions on multiple rows, grouped together. They’re essentially an extension of aggregated attributes to include a variant filter and a phrase. You can define calculated values using single or multiple attributes on Qbo.
Aggregates are typically business metrics, like net profit and gross AUM, that you can use to refer to summations and averages under certain filter conditions. You can configure aggregates like this and create synonyms for them.
You need to provide:
The phrase that would be used to refer to the aggregate.
The attribute that will be aggregated (not required when aggregate function is
count).- The aggregate function needed. This could be:
sum,min,max,count,distinct count, average,standard deviation,variance,population standard deviationorpopulation variance.
- The aggregate function needed. This could be:
The entity name usage criteria. This could be either
requiredorprohibited.
The entity name usage, when set to required, supports questions like What is the average customer spending
compared to questions like What is the canceled amount of the transactions. In these examples, average
customer spending and canceled amount are named aggregates.
You can also configure NLP synonyms for named aggregates to include additional terms that could be used to access them.
Related Videos
Create a named aggregate in Qbo
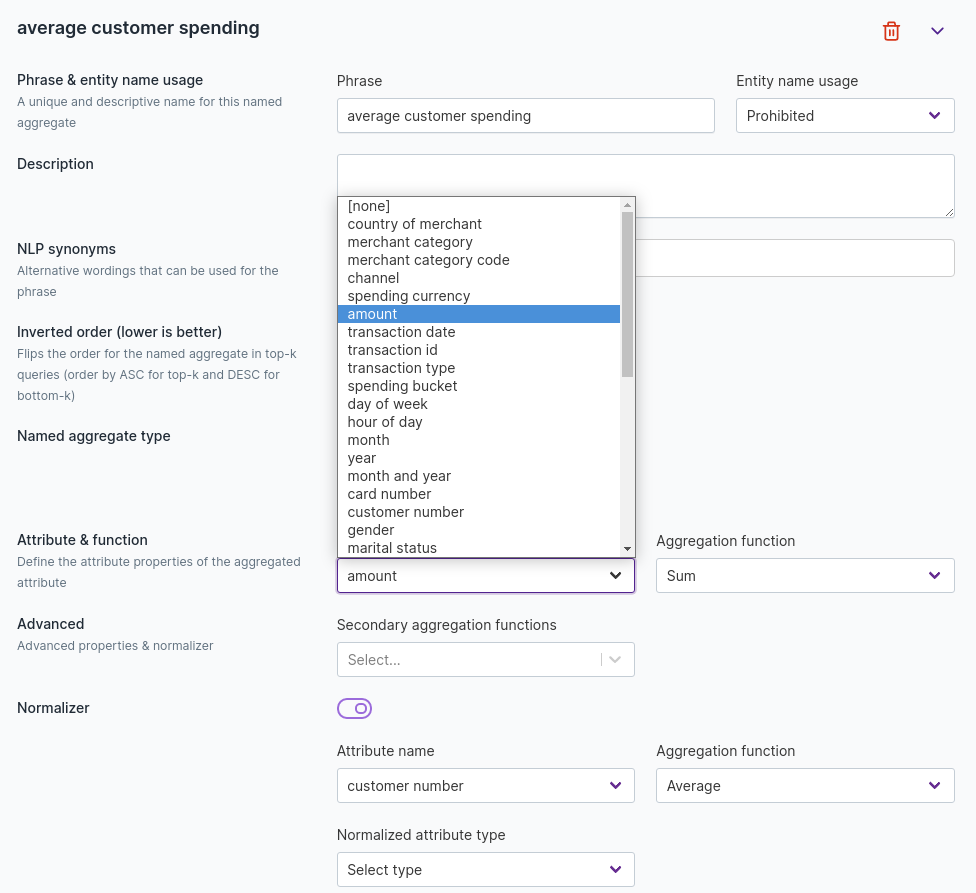
Aggregate Phrase
You can name a calculated aggregate to define the aggregate.
For example, if we calculate the average customer spending by loyal customers, we can name the aggregate as average customer spending.
Note
We recommend that you use lower case while adding the aggregate phrase. The named aggregate will be displayed in visualizations.
Entity Usage Name
You might need to configure Qbo to use the same aggregate phrase in different contexts to apply to different entities. For example, total sales is an aggregate on both sales and transaction entities.
Prohibited - This is a default selection. In case of named aggregates having similar attribute phrases, Qbo will
prompt you to choose an appropriate entity from where it would serve the value of the aggregate.
Required - Selecting this option will force Qbo to give a response to the query with specific entities mentioned in
them. For example, these phrases with enabled Required options:
Total sales in the last year- NoTotal sales of the transaction in the last year- Yes
Aggregated Attribute Type
You can select the attribute in your entity on which you can define aggregated values.
Note
The selected attribute will also be a numerator when you are trying to calculate the aggregate by dividing two attributes.
You can select derived attributes instead of attributes to calculate the aggregate.
Aggregate function
You can select the function to use for calculating an aggregate.
Qbo offers more than 10 different functions, like Sum, Min, Max, Count, Distinct Count, and
average, that you can apply to an attribute to calculate the aggregate.
NLP synonyms
You can add multiple synonyms or alternate phrases by which you would like to use an aggregate. This feature
allows business users to refer to the aggregate using popular business terms. For example, possible
synonyms for average customer spending include avg customer spending.
When you type any of the synonyms inside a query, Qbo will prompt the actual aggregate - for example, average
customer spending - and give a response.
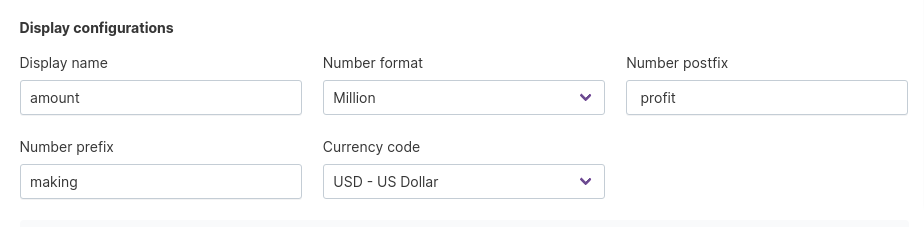
Display Configurations
Display Name
You can change the display name of the aggregate shown in a report or visualization.
For example, you can display the aggregate Total spending as Customer spending in generated visualizations.
Number Format
You can select the appropriate Number format to use in displaying the aggregated value.
For example, you can display values of Total spending in millions instead of numerical values:
Total spending - 1,005,735 ---> 1M
Number Postfix
You can add postfix characters to aggregate values to better qualify the units used.
For example, you can add postfix characters USD to total spending in order to help viewers understand
the currency used:
Total spending -----> 1,005,735USD
Number Prefix
You can add a prefix characters to aggregate values to add more context or meaning to the aggregate.
For example, you can add a dollar sign $ to total spending:
Total spending -----> $1,005,735
Currency Code
You can choose the currency in which you want to display the aggregated value of accounting data.
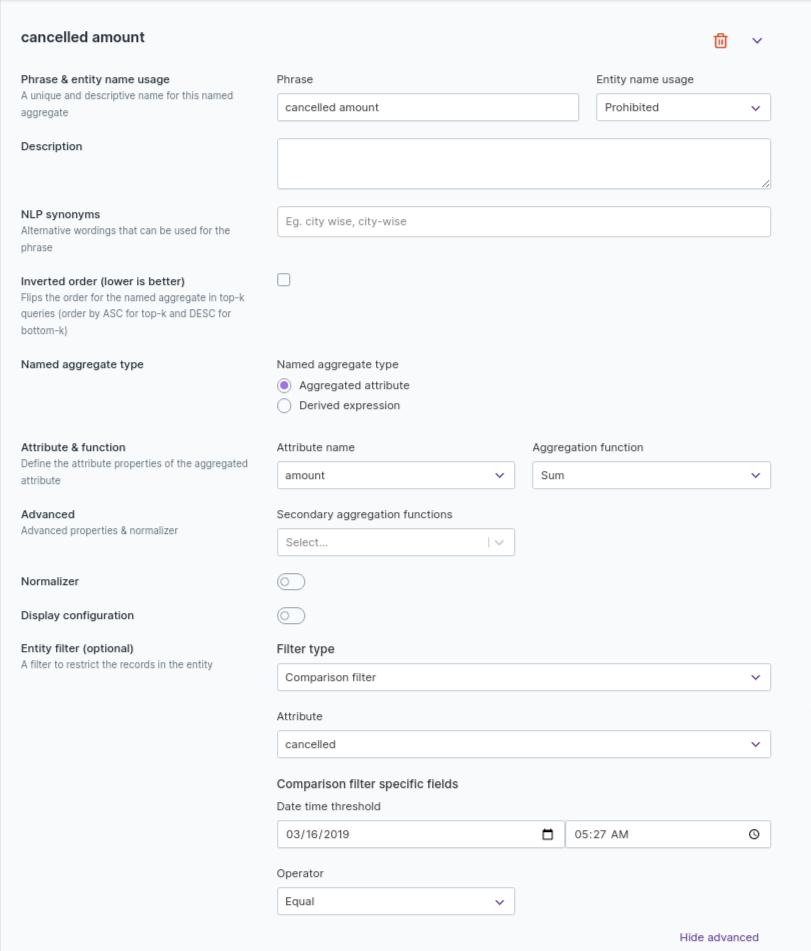
Filter Configuration
The filter configuration is used to limit the data that is used to compute the aggregate. For example, to calculate
the amount associated with canceled transactions, you can set up a filter - canceled = true - to
determine the canceled transactions. You can find out more about complex filter criteria and types of filters
in more depth later in this section.
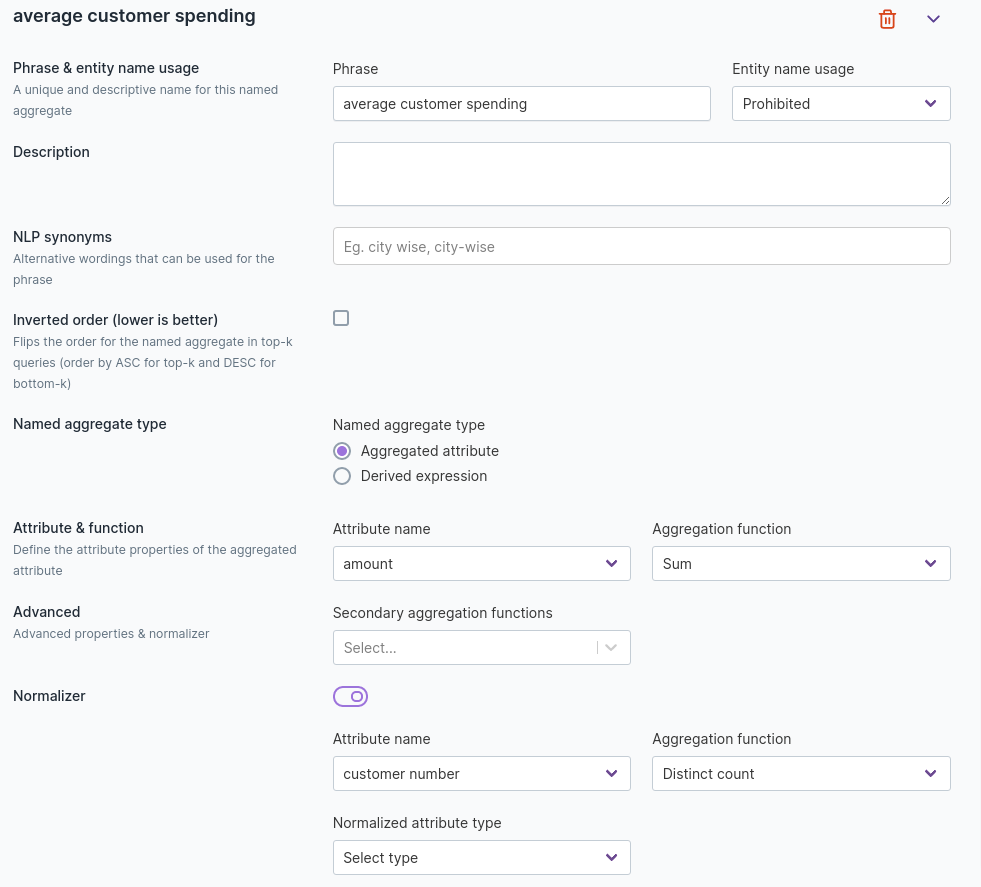
Normalizer
You can define an aggregate by dividing two attributes and implement it using the normalizer function.
To enable the Display Configuration option on named aggregates, meet the following conditions.
We need the aggregation function, aggregated attribute type (may be null), and normalizer for a proper check. This might also affect changes on the normalizer.
If the attribute type is INTEGER and the aggregation function is one of [average, variance, std. deviation, population variance, population std. deviation], then the attribute type is set to DOUBLE. This can change if there is a normalizer and it has a normalized attribute type. So we cannot directly return for now.
If the aggregation function is one of [count, distinct count], then the attribute type is set to be INTEGER. This can change if there is a normalizer and it has a normalized attribute type. So we cannot directly return for now.
1 and 2 are mutually exclusive.
If there is no normalizer, we can return the attribute type we found on 1 or 2.
If we have a normalizer, and it has its own normalized attribute type, it is our eventual type. So we return that.
If the attribute type is INTEGER up until this point, we convert it to DOUBLE, because normalization is a division operation.
We are done.
You can use multiple named aggregates with filters in the same query. For example, assume that net transaction amount and cancelled transaction amount are two named aggregates with potentially different filters. You can ask:
What is the net transaction amount and canceled transaction amount?
Qbo can refine aggregation queries to add or replace named aggregates with implicit entity names. For example:
What is the total number of the transactions?Refine and also show the net spending amountWhat is the average customer spending and canceled amount of the transactions?What is the average spending of customers?Refine and group monthlyRefine and also show the net amountReferencing named aggregate
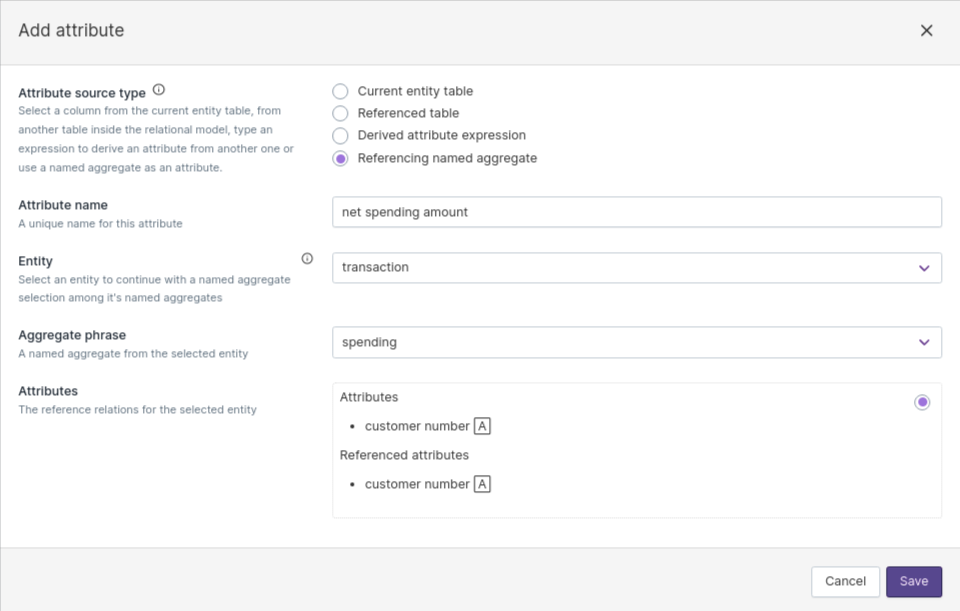
A referencing named aggregate is a calculated attribute. It references an existing named aggregate in a referencing entity. An attribute of this kind is calculated by grouping the data in the referencing entity by the current entity and running the named aggregate for each of these groups.
For example,
we have a named aggregate named net spending amount in the transaction entity. This named aggregate sums
the amounts that are not canceled in the transaction entity.
We declare an attribute named spend in the customer entity. We declare that this attribute references the
net spending amount named aggregate in the transaction entity.
Values of this attribute are calculated by grouping the transaction entity by the customer and aggregating
net spending amount for each of these groups.
The result gives the total amount that is spent by each customer. We might choose to display this attribute
with the other attributes of the customer entity.
Referenced entities
Reference is a relationship between entities in which one entity designates, or acts as a means by which to connect to or link to, another entity. The first entity in this relationship is said to refer to the second entity.
Reference tables are a special type of profile table. They are most useful when they are joined with profile, transaction or aggregate tables. For example, a location reference table gives the latitude and longitude of each city mentioned in another table. Or a product reference table gives details about products mentioned in sales transactions or an inventory table.
Some best practices for dealing with referenced entities:
Reference tables usually have a primary key that is used for joining with the other tables. For example, this could be a city name or a product ID.
Reference tables can be specified as reference relations for other entities.
It is often useful to add attributes in the reference tables as attributes in other tables to simplify the query construction.
For this we need to add new entities. You can refer to the next few sections on how we can add or delete entities.
Follow these steps to configure Referenced Entities:
Select an Entity from the list of entities on the left for which you want to configure
Referenced Entities.Scroll down to the Referenced entities settings.
Click Add reference relation.
Select Referenced Entity from the drop down.
Select an attribute from the drop down and provide phrases for referenced and referencing entities.
For example, look at the schema of the CUSTOMER and COUNTRY entities. Entity COUNTRY has an attribute
name and entity CUSTOMER has attributes country_of_birth and country that can be referenced.
Update COUNTRY as a referenced entity in the CUSTOMER entity.
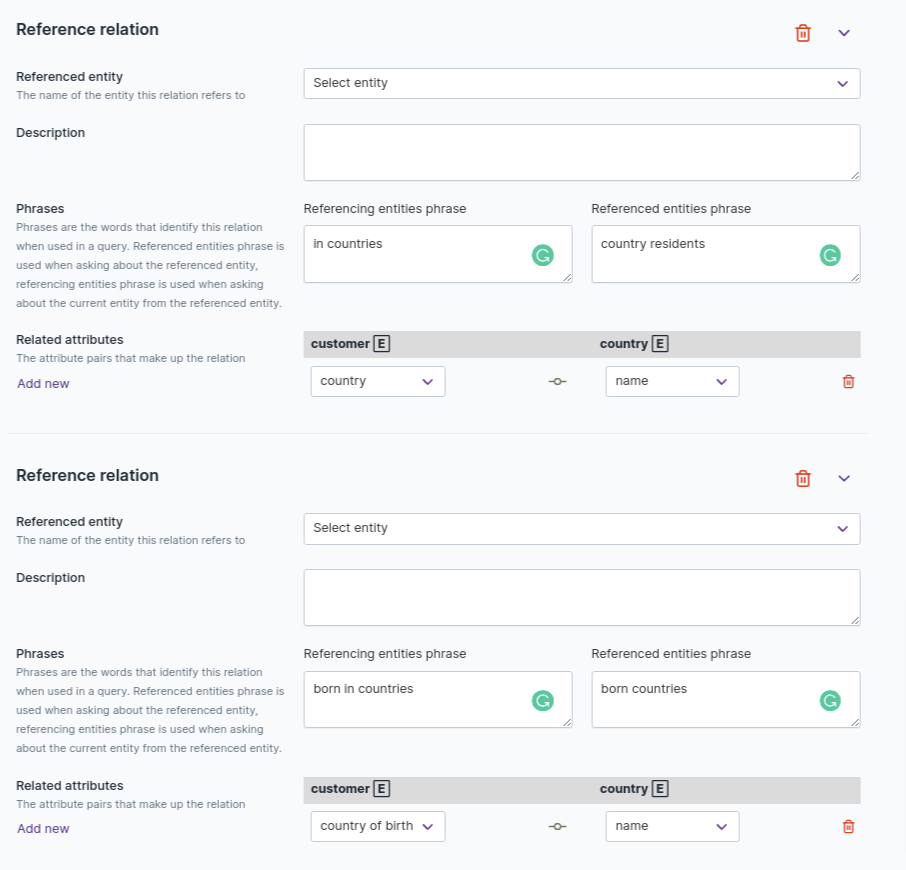
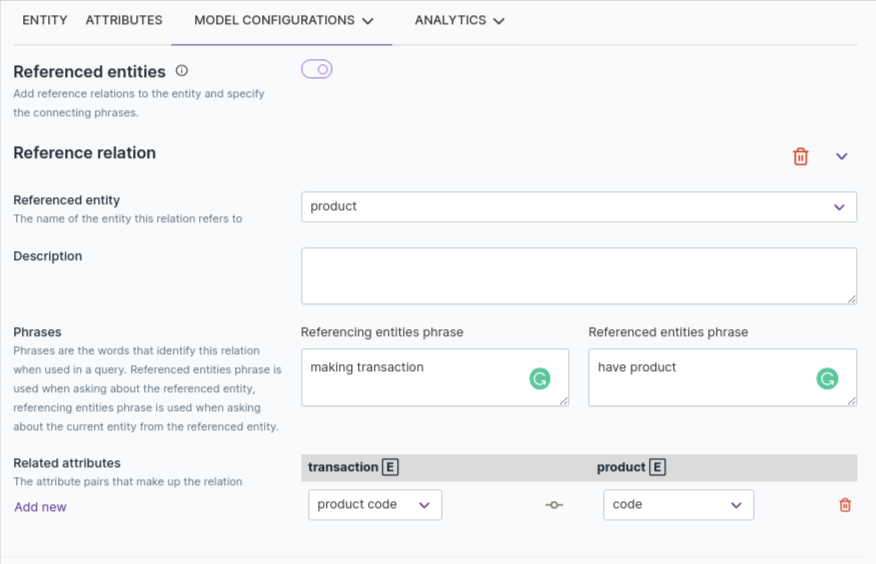
Another example: Entities TRANSACTION and PRODUCT. Entity TRANSACTION has an attribute product_code
and entity PRODUCT has an attribute code that can be referenced. Update PRODUCT as a referenced entity
in the TRANSACTION entity.
After making all the changes, save the draft and then activate it to reflect your changes.
This will allow you to ask questions like:
Who are the customers born in the country Korea?Who are the customers in countries with population greater than 1000?Transactions that have product description hat?Products making transactions with quantity greater than 9?Multiple level nesting is also supported. For example, What are the transactions from customers in countries with population greater than 1000? Note that this query moves from transactions to customers to countries.
Delete an entity
To delete an entity:
Select database from Data Sources.
Click the Edit button in the top right corner.
Click the delete icon to delete an entity. For example,
CUSTOMER.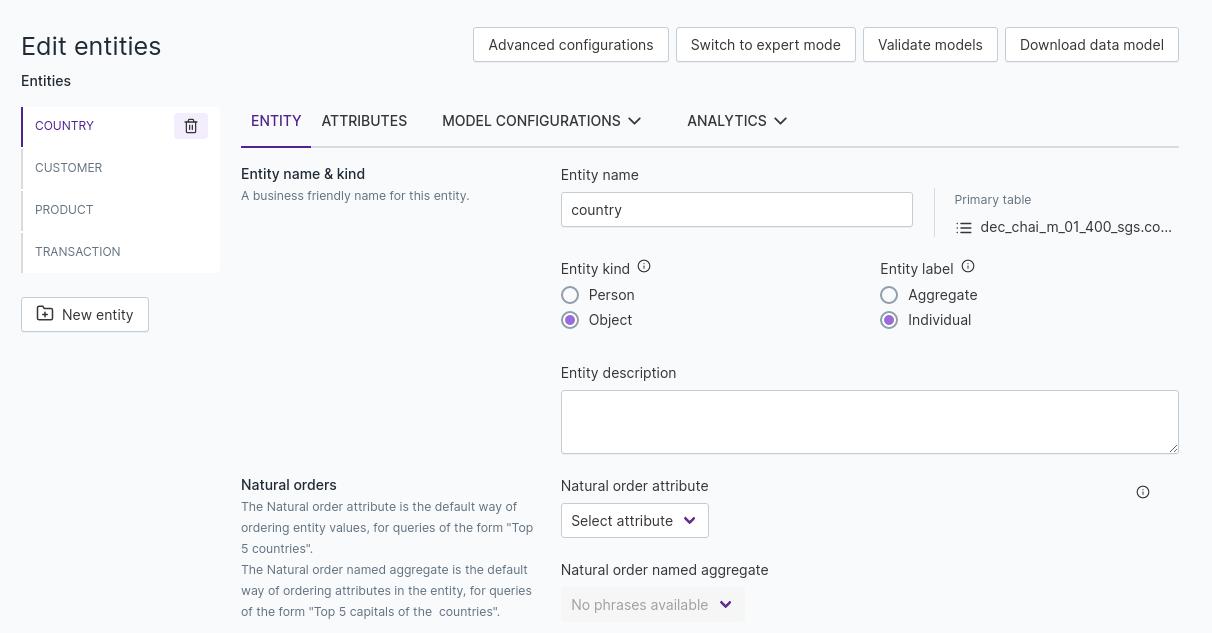
After deleting, click Save draft, then Activate draft.
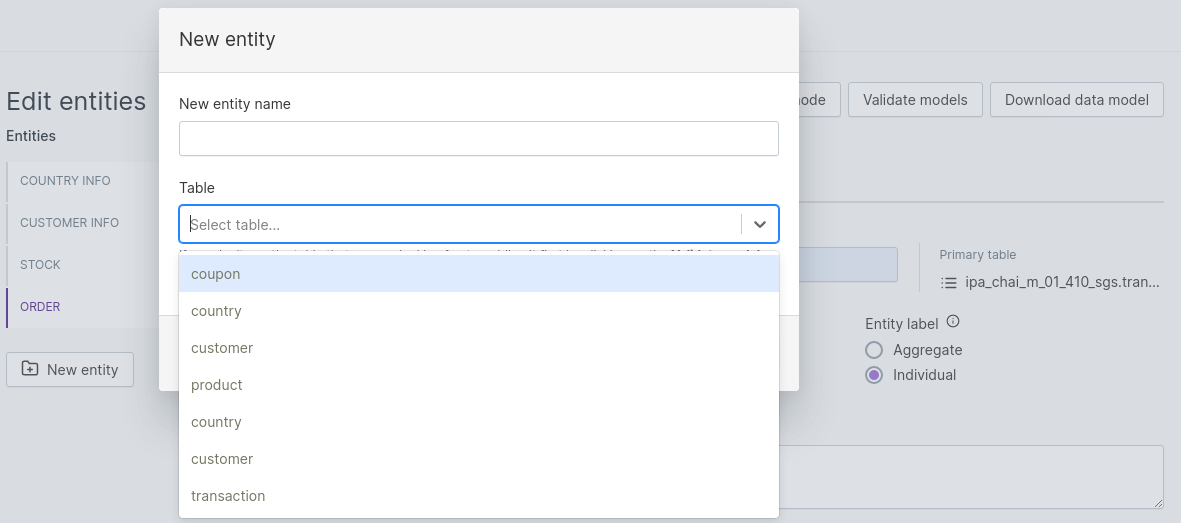
Add an entity
To add an entity:
Select database from the added Data Sources.
Click the Edit button in the top right corner.
Click the new entity icon to add an entity. For example,
PURCHASE.Select a table name from the drop down and enter the entity name.
After adding, click Save draft and then Activate draft.
Validate Models
Validate Models functionality in Qbo helps you to solve Entity relationship problems which is faced if there is certain change in the data model. The validate model evaluates any discrepancy in the ER model and throws an error if it finds any. The validate model helps us to solve two primary challenges:
If there is certain change in the existing tables like a change in the name of a column or deletion of an existing table, it will automatically disable the data source and once its validated and the errors resolved, it will provide an option to enable the data source.
If a new table has to be added in the Entity section, the ER model has to be validated first and only then will it provide the option to add a new Entity.
To validate models:
Click on the Edit button to initiate the changes
Click on Validate Models
If there are any issues, resolve them
If a new entity is to be added, select the entity into the Selected Tables section
Click on Save changes to save the model
After adding, click Save draft and then Activate draft.

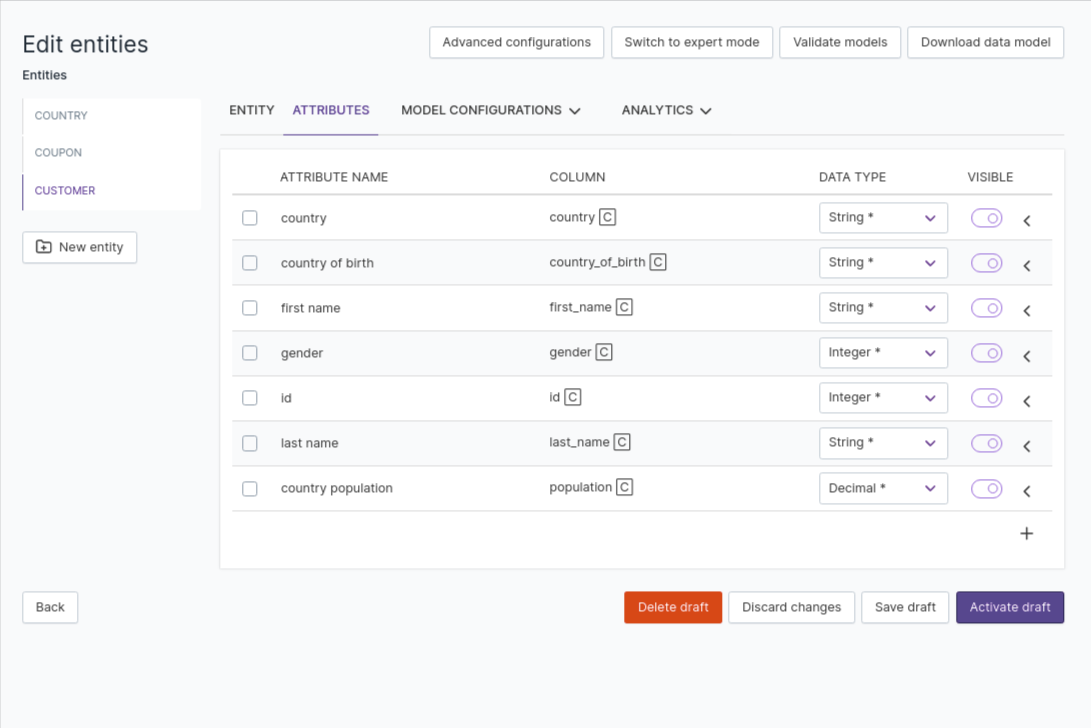
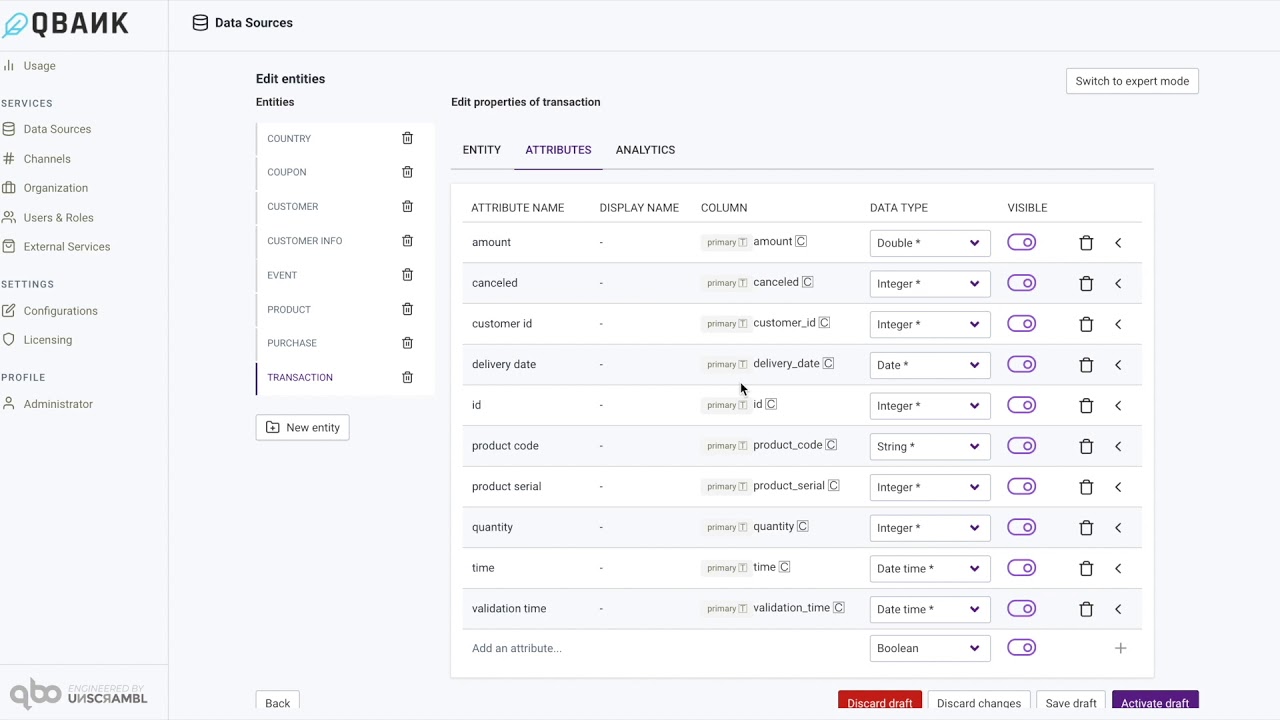
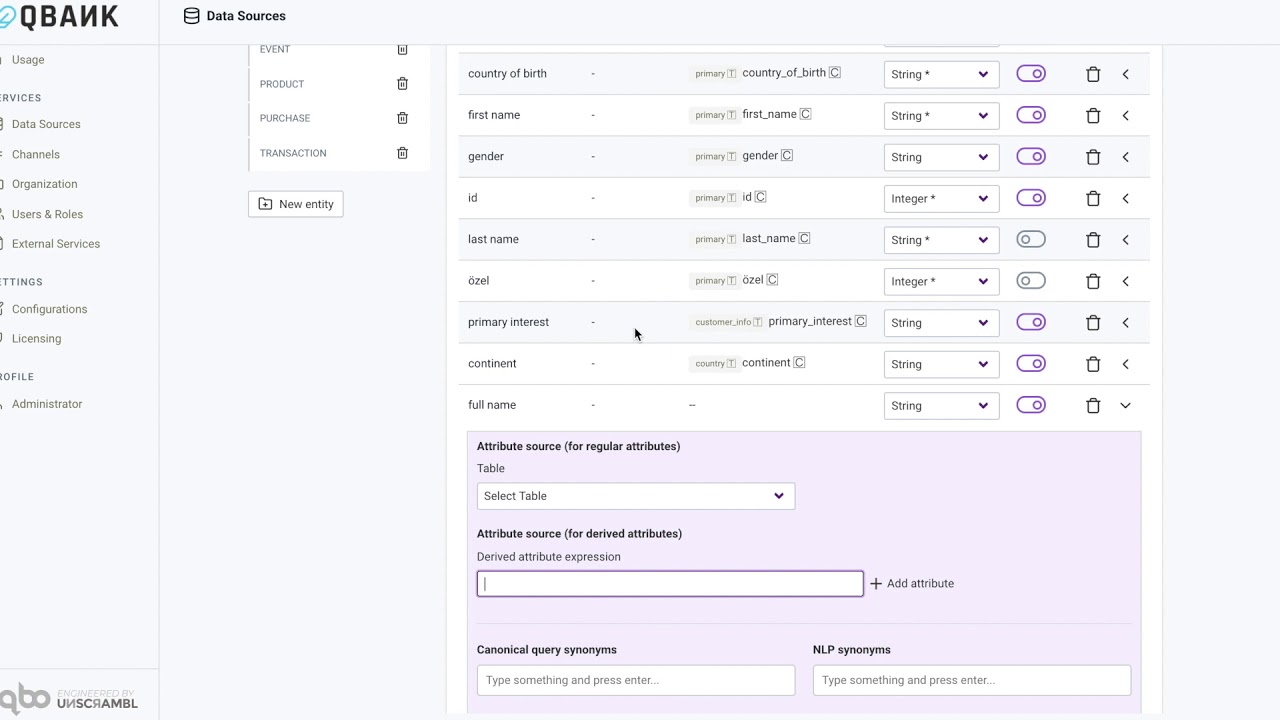
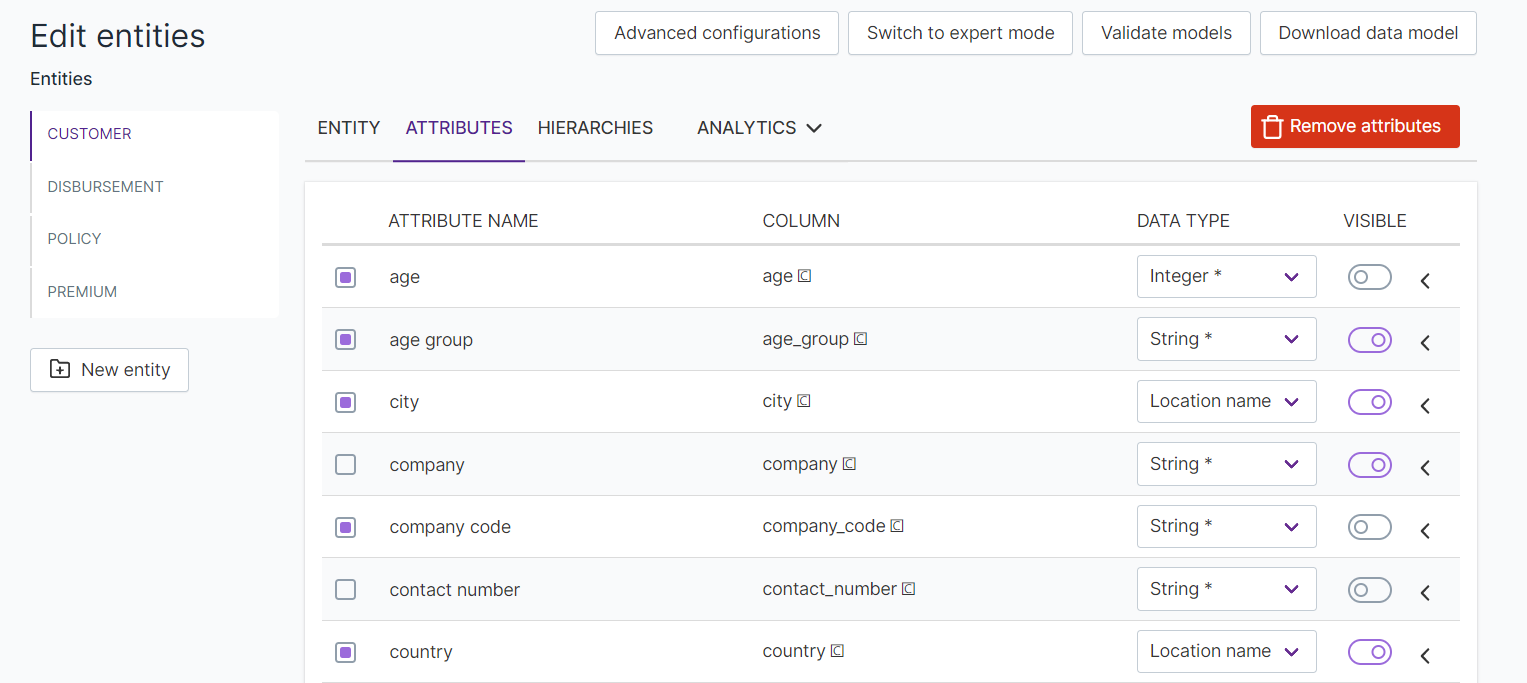
Attributes of an entity
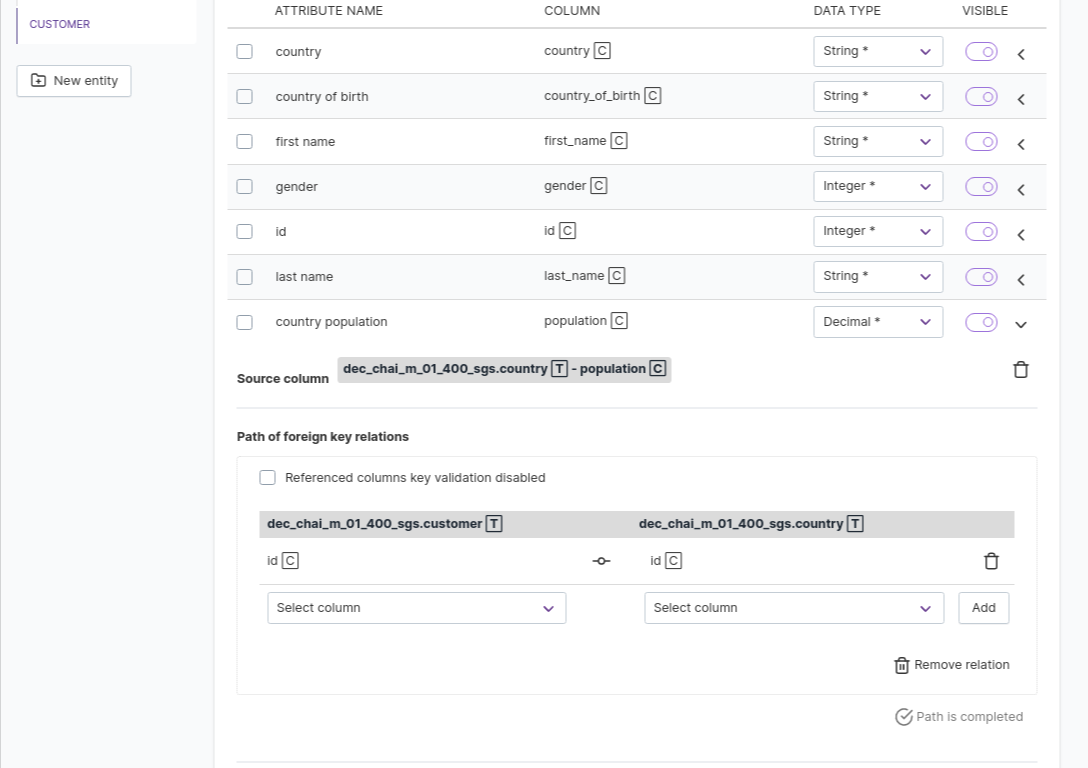
An entity can have 1 or more attributes. These attributes can come from the primary table, or from other tables by specifying the relationship between the primary table and the table in question. When adding attributes from a table other than the primary table, the relationship conditions must result in exactly 1 row being fetched from the target table. In a typical database schema definition, this occurs when there is a foreign key in the primary table that maps to the primary key in the target table.
Attribute with a path of foreign key relation
This type of attribute does not come from a column of the primary table. Instead, it comes from a column of a table related to the primary table. We can declare this type of attribute only if there is a foreign key relation path between the two tables, and all of these relationships are either one-to-one or many-to-one.
For example:
We declare country population as an attribute of the customer entity. We declare that the population
attribute comes from the population column of the country table.
Then we declare the foreign key relation path for it, which is essentially the table join conditions, to get the
desired column.
The foreign key relation path for this attribute would be: [(customer.country -> country.name)].
We can do this because for each customer there is only one country.
We can also chain foreign key relation paths. For example,
we declare country population as one of the attributes of the transaction entity. We declare that the
population attribute comes from the population column of the country table.
Then we declare the foreign key relation path for it, essentially the table join conditions, in order to get the
desired column.
The foreign key relation path for this attribute would be: [(transaction.customer_id -> customer.id),
(customer.country -> country.name)].
We can do this because for each transaction there is only one customer, and for each customer, there is only one country.
Note
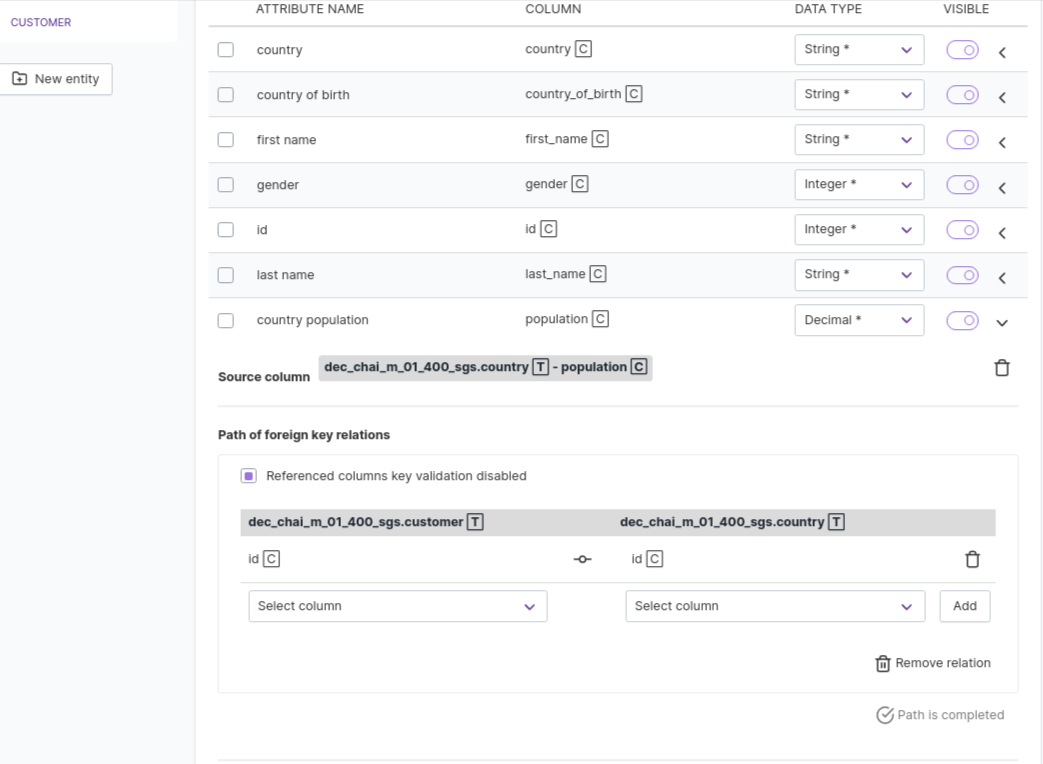
If you have a foreign key relationship but do not want it to be validated, then select Referenced columns
key validation disabled.
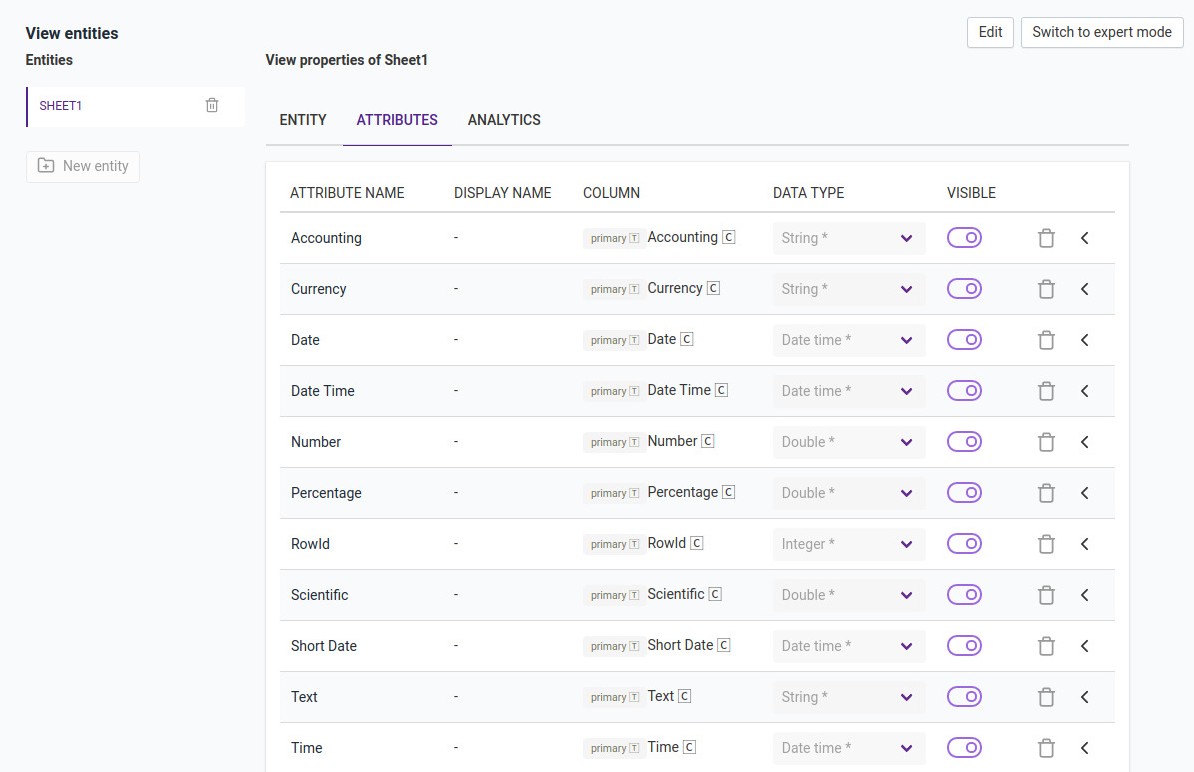
For a selected entity, the Attributes tab lists all the attributes associated with the entity and provides an easy interface for editing configurations associated with an attribute.
Related Videos
Logical data model and entities
The concept of primary key and value substitute
Path of foreign key
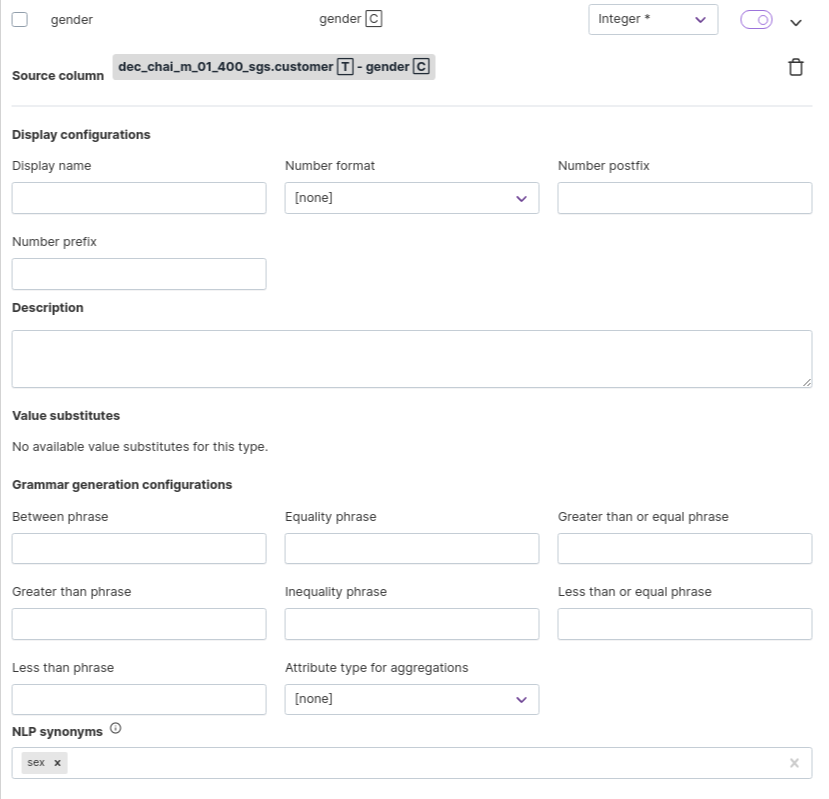
You can edit the name of an attribute so that it does not match the column name as retrieved from the database.
Click the name of the attribute to edit it. The source column and the table name,
primary or otherwise, from the data source is displayed under the column heading.
You can change the Data Type of the attribute as long as it is compatible with the type in the backing data source.
For example, an Integer attribute from the backing data source can be mapped to a String. The interface throws an error
when incompatible types are detected.
An entity may have several attributes. If you want to limit the attributes shown by default, in response to a query like Who are the customers or What are the transactions, disable the Visible toggle for the attributes that need to be hidden. Please note that the user can still explicitly request these attributes using a query like What is the age of the customers? Age will show up even if the attribute is marked as not visible.
There are several other configurations that are enabled for an attribute. Click the chevron on the right of each attribute listing to access it.
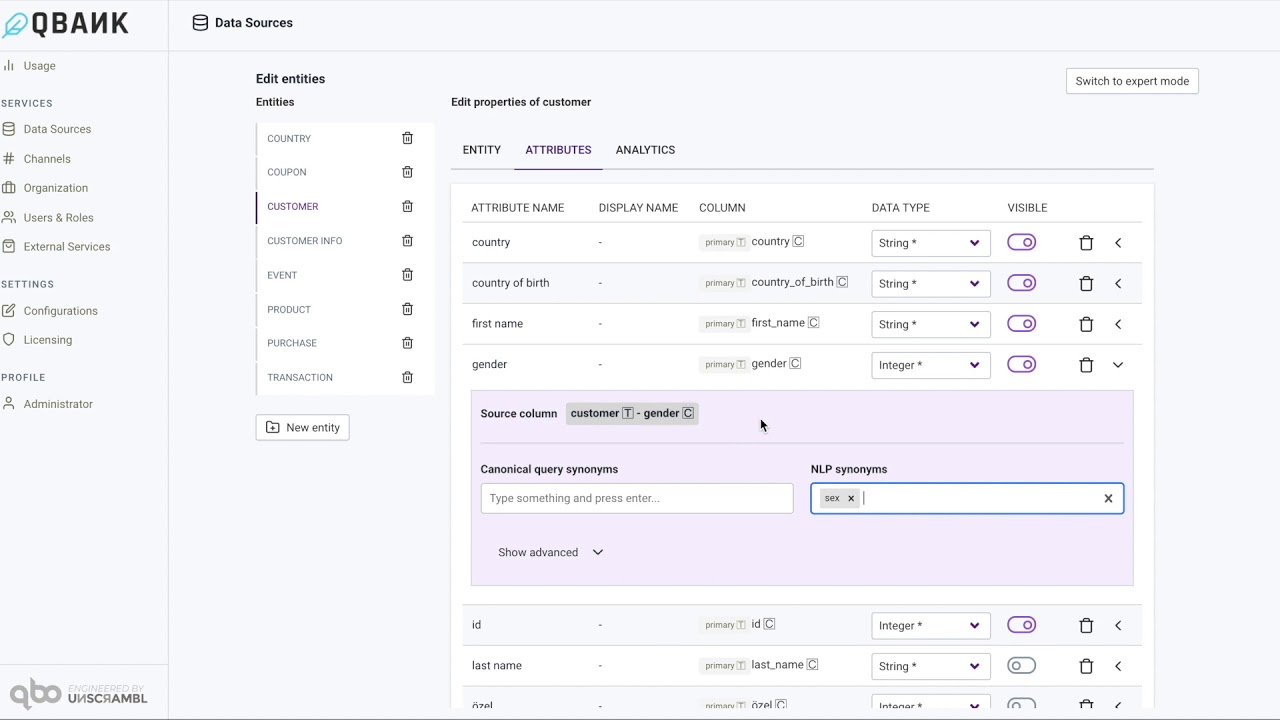
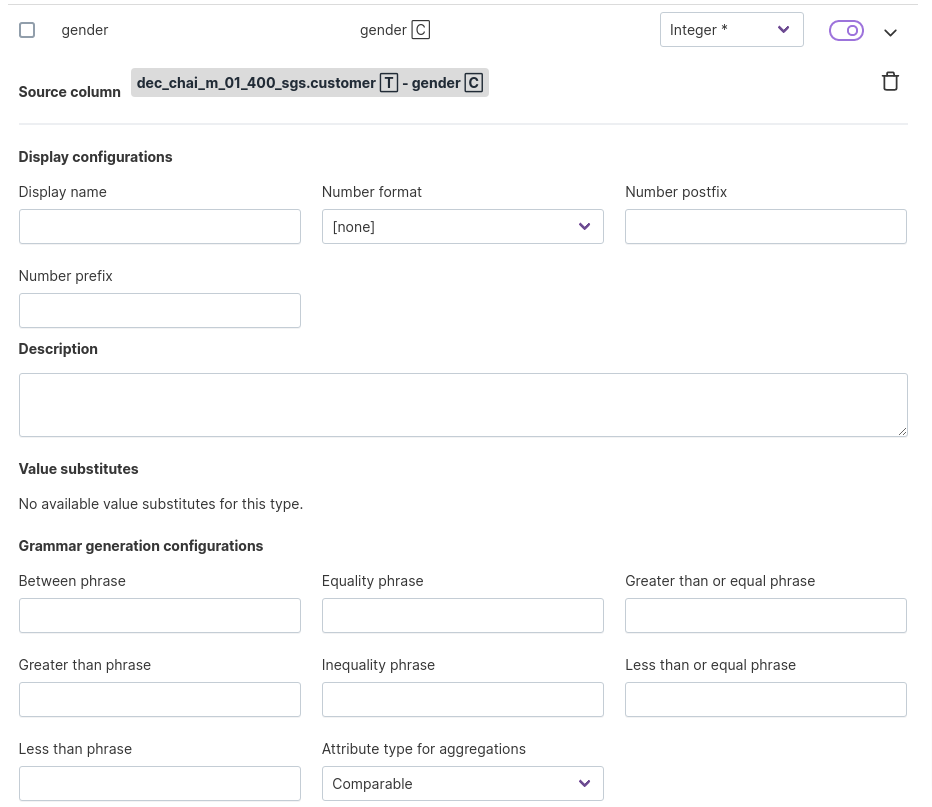
Value Substitutes
You can add value substitutes for attributes with String data type in the expanded configuration interface.
For example, you can map 0 to Female and 1 to Male - even if the gender column is of Integer
type in the database.
This allows you to ask a question like Who are the customers with gender of female? even when the database has
values of 0 and 1 in the gender column.
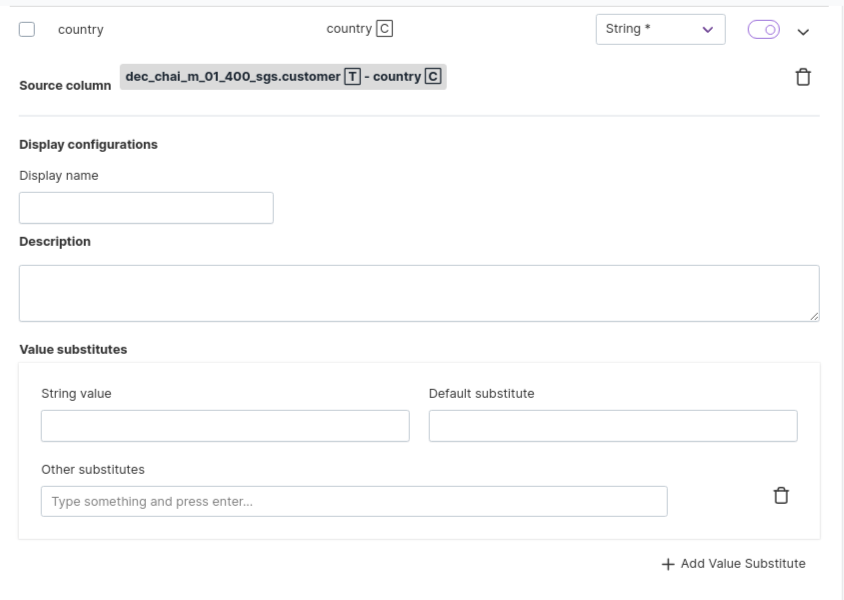
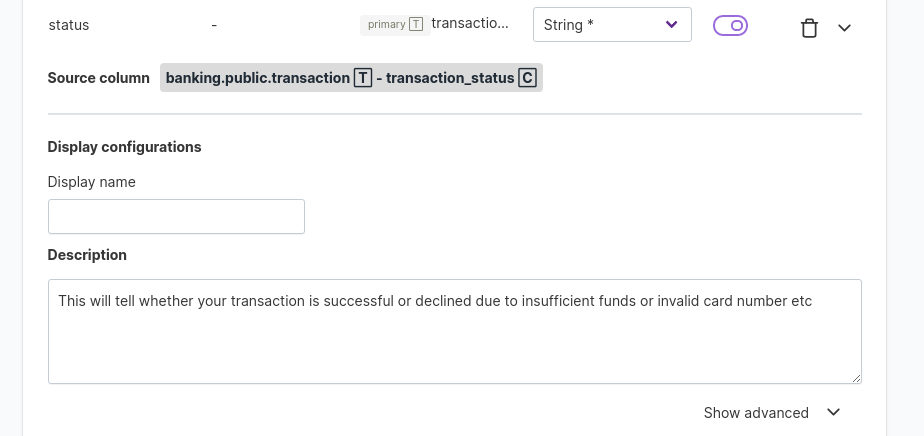
Description
You can add description for the attribute inside the description text box so that other users will get clear idea about it.
Grammar generation configuration
Grammar generation configuration is supported for Boolean, Numerical (Integer, Decimal, Double, Percent and Currency),
String and Temporal (Date and ``Datetime) attributes.
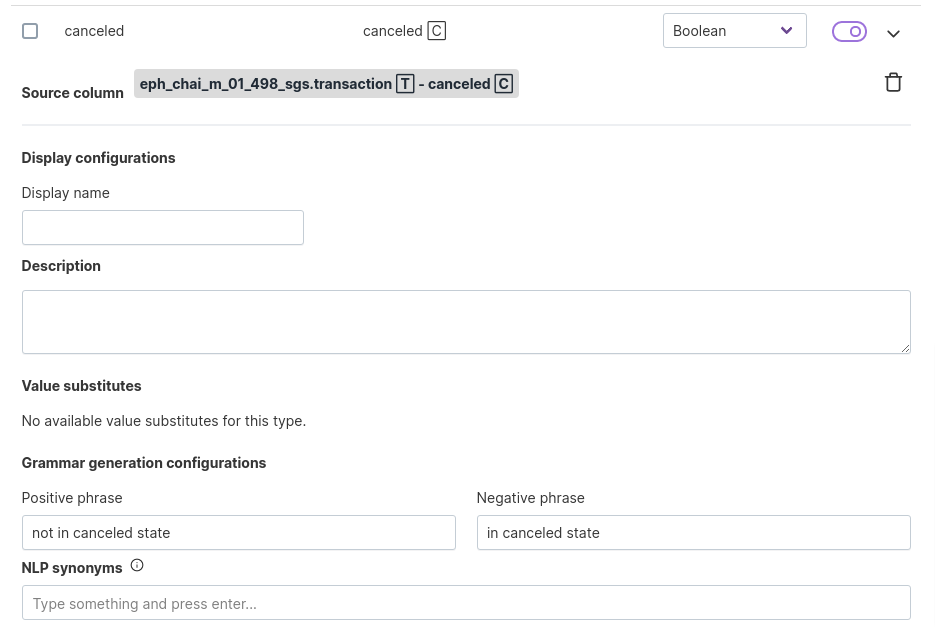
Boolean attributes support positive and negative phrases. These phrases help us to create the same query
in different forms.
For example, this query has no configuration: What are the transactions that are canceled? In this query,
canceled is a Boolean attribute. If you want to use the word state in the query for this attribute, you can add
configure not in canceled state for the negative phrase and in canceled state for the positive phrase. Now the same
query can be asked with the phrases you provided in the configuration: What are the transactions in canceled state?
For attributes with Numeric data type, a number of grammar generation configurations are available. The Between phrase can be used
to configure the phrase used to find a number between two values. The Equality phrase, like priced exactly,
adds a more human touch to the question phrasing. This configuration permits us to ask questions like What are the products priced
exactly 10.0? instead of the default (What are the products with price 10.0?*. Other configurations like the Greater than or equal phrase,
Greater than phrase, Inequality phrase, Less than or equal phrase and Less than phrase
help refine the phrasing further.
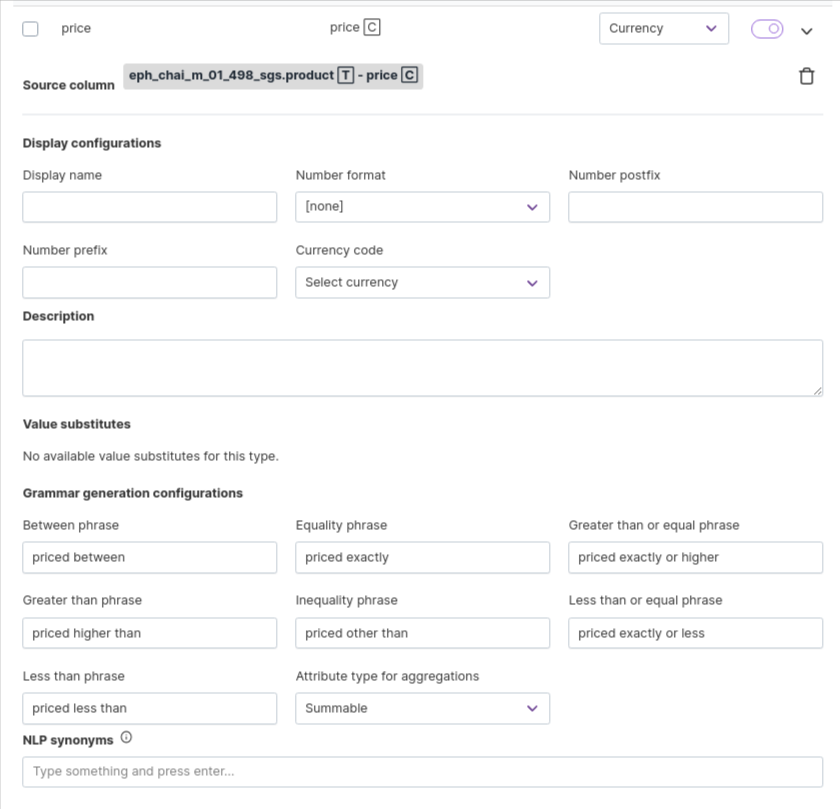
The Attribute type for aggregations is almost always summable for numeric attributes, which means that the attribute can be summed.
For some cases, like when an id is an integer or a product code is an integer, we may want to limit it to be only countable
or comparable.
For attributes with String data type, similar to the grammar generation configurations for the Numeric attribute types, a number of
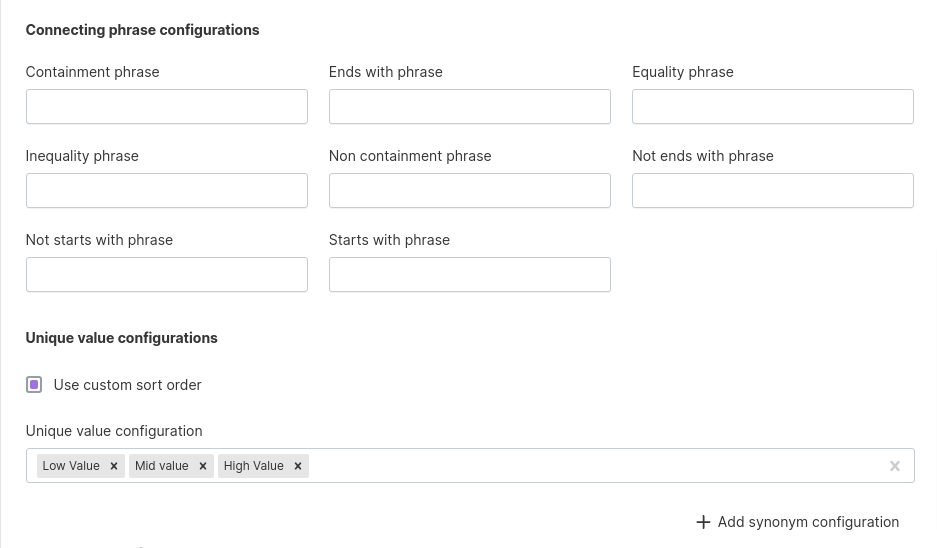
configuration phrases are available that help us humanize the queries to be asked. String attributes also allow an additional configuration
that enables custom sort order. This custom sort order is useful for scenarios where the alphabetical sort of the
String attribute is counter-intuitive.
For example, consider a segment attribute with values High Value, Mid Value and Low Value. These
will get sorted as High Value, Low Value and Mid Value in ascending order - but this won’t be the logical
order to use. Custom sort configuration alleviates this problem.
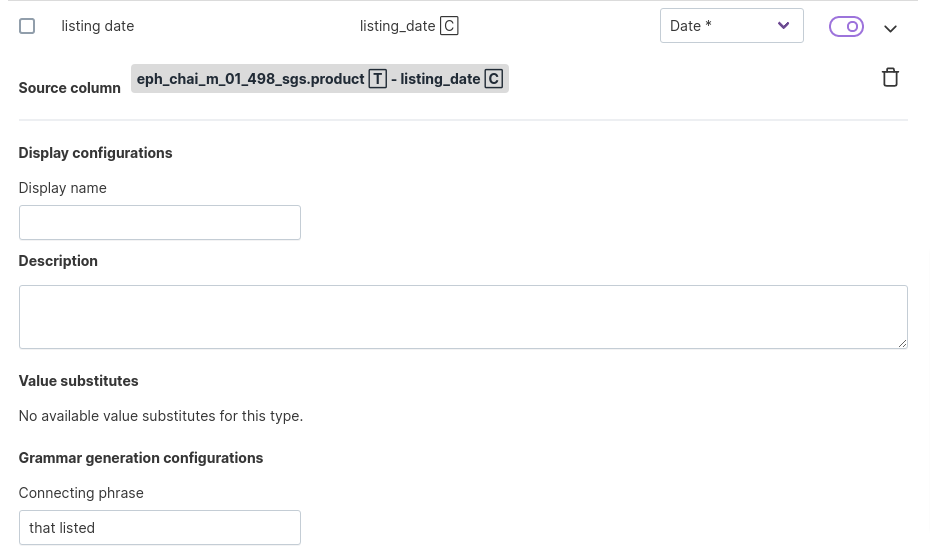
For Temporal attributes like the Date and Datetime, you can configure a Connecting phrase.
For example, the attribute configuration below allows a user to ask, What are the products that listed after
2019-04-27? instead of the default question What are the products with listing date after 2019-04-27?.
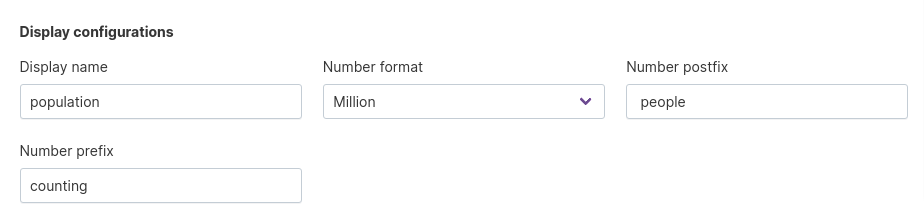
Display configuration
For Numeric attribute types other than Currency, you can set Number format, Number postfix and
Number prefix configurations to prepend or append a tag to the number in visualization labels.
For example, you could modify 51.57M label to be displayed as counting 51.47M people.
For Currency attribute types, you can set the currency code, so that each value for that attribute has that
currency code added to the label in visualizations.
For example, you could modify 51.57M label to be displayed as making 51.47M USD profit.
Synonyms
You can set up synonyms for referring to an attribute. For example, set up pay as a synonym for salary,
so that questions like, What is the salary of the customers? and What is the pay of the customers? will return
the same response.
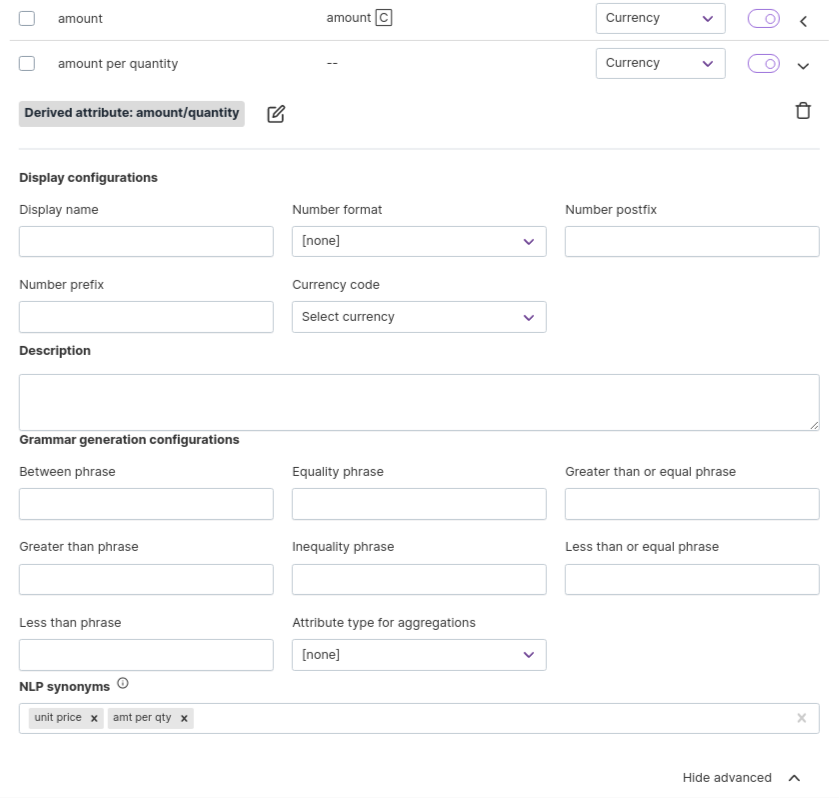
Derived attribute
Derived attributes are made up of other attributes. They do not actually exist in the database schema. They are calculated on the fly and presented as regular attributes. You can recognize derived attributes - as opposed to regular attributes - by the derivedAttributeExpression field. If this field is filled, the attribute is a derived attribute. Another distinguishing point for derived attributes is that they do not have an attribute mapping defined for them. This is because they are calculated attributes and not physical ones. They also do not have value substitutes or path of foreign keys defined.
The expression for a derived attribute is a string written in the Unscrambl Chai Expression Language (UEL). Qbo parses this expression and generates the SQL equivalent to it. With UEL, Qbo can support binary arithmetic operations, ternary operations, and value literals. In future, it will also support the remaining operations and functions.
Examples of derived attributes with expressions:
an attribute named
profitcan be defined asrevenue - costan attribute named
unit pricecan be defined asamount / quantityan attribute named
price over 100 or 0can be defined asprice > 100 ? price : 0an attribute named
quantity doubledcan be defined as2 * quantity
Here’s an example of new attributes derived using existing attributes:
Related Videos
Derived attributes in Qbo
Delete multiple attributes
You can delete one or more attributes in an entity by selecting the checkbox
before the attribute name and click on Remove attributes button.
selected attributes are deleted successfully as given below,
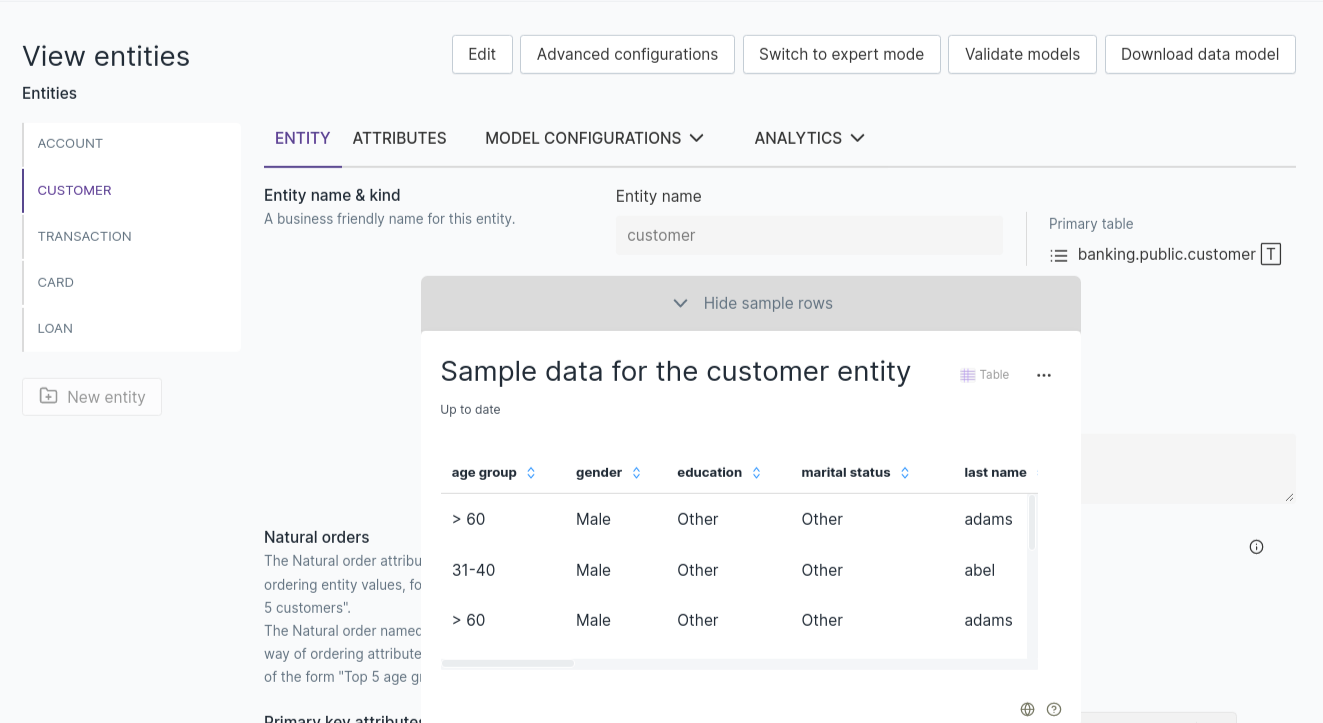
Sample rows
For every entity, there is a collapse button at the bottom of the page named Show Sample Rows which provides 10 rows from that particular entity and only shows the values of attributes that have visibility enabled.

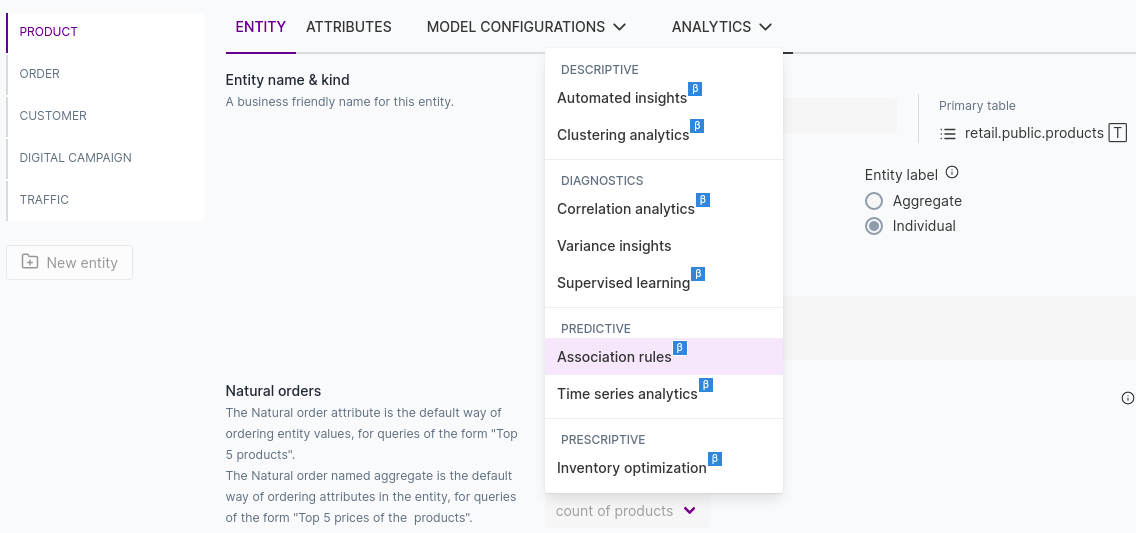
Overall Analytics Framework
Qbo can perform analytics that can be broadly classified into 4 categories: Descriptive, Diagnostic, Predictive and Prescriptive. To read more about them, see Analytics configuration. The Overall Analytics Framework will help you to set up analytical recurrences from the data source and global configuration. This will help you to create recurrences and look at how to run them.
Global configuration
Qbo creates a separate table to store the output of the various analytical models that are running. Setting up the global configuration will allow you to connect to the database and get access to that table.
Go to the Settings page, click Analytics.
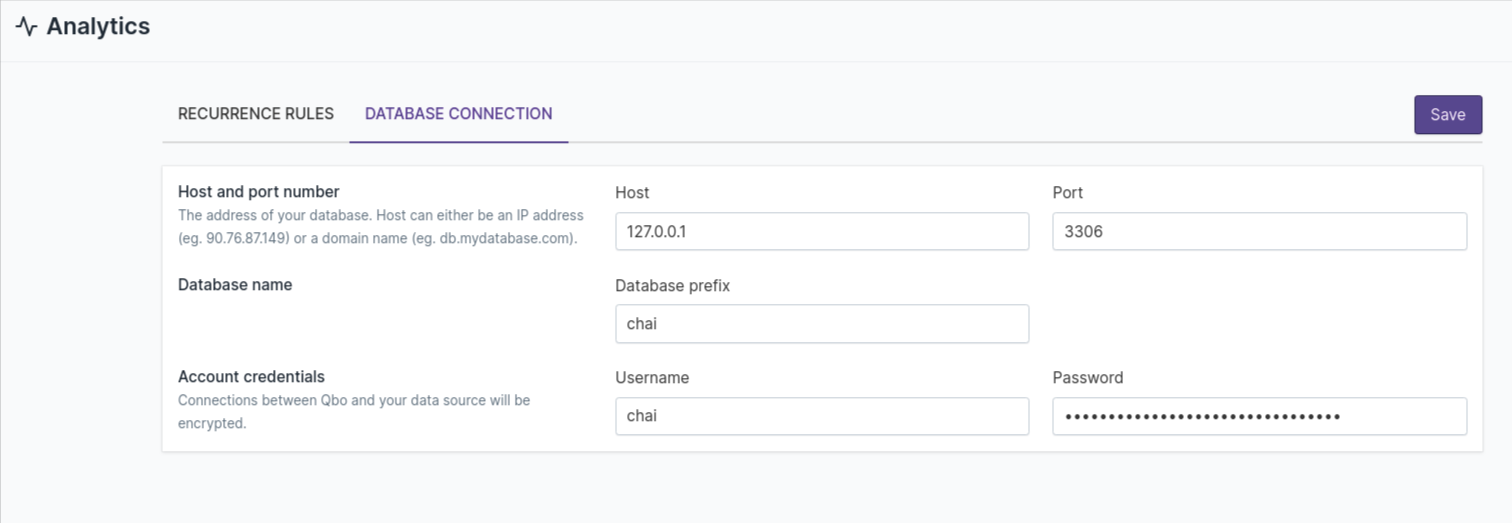
Input the data source connection information and credentials:
Host: 127.0.0.1
Port: 3306
Database prefix: chai
Username: chai
Password: Confirm with IT Team
Schedule: Schedule the recurrence on a daily, weekly, or monthly basis, as needed.
Click the Save button.
Setting recurrence in the data source
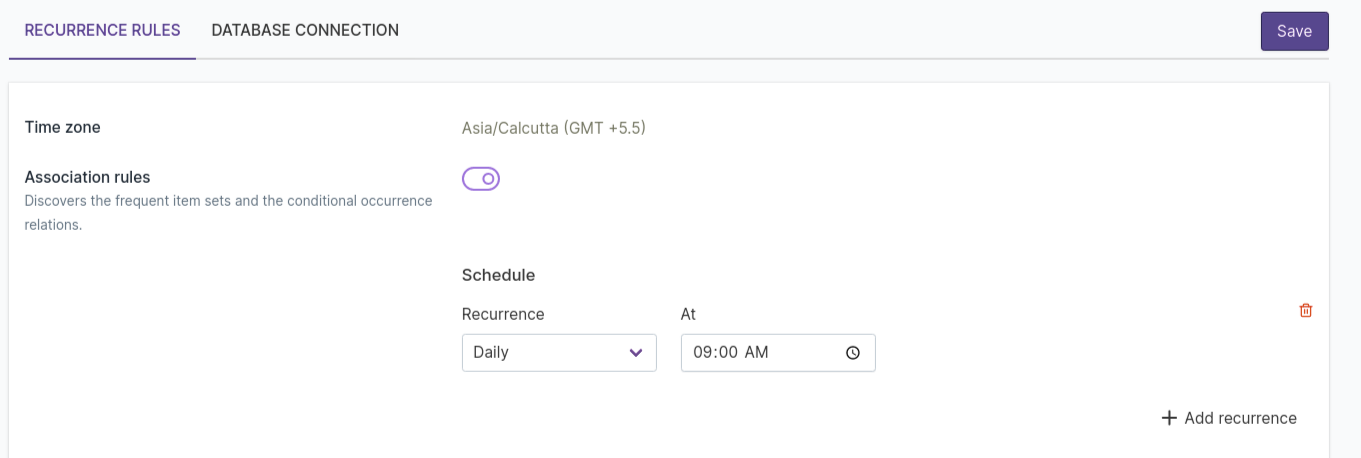
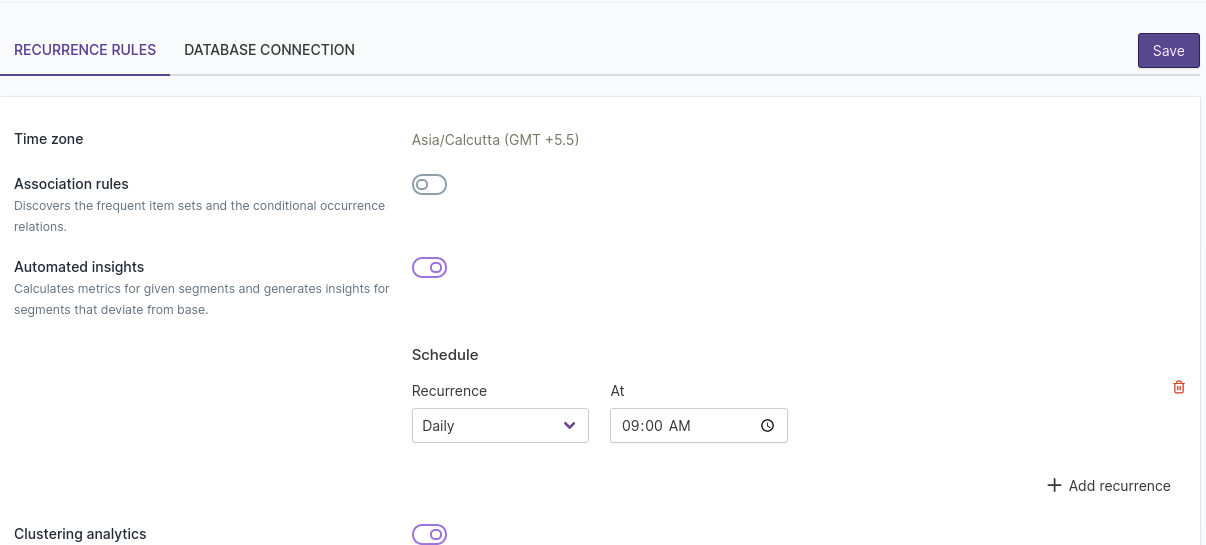
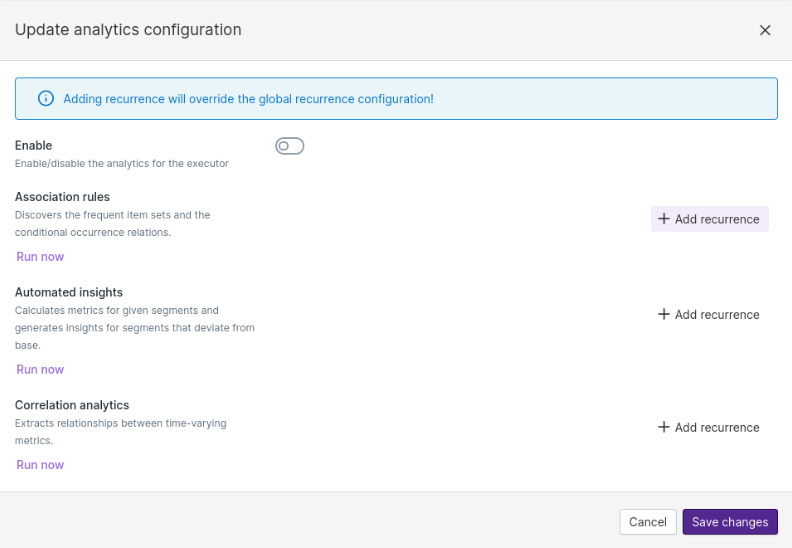
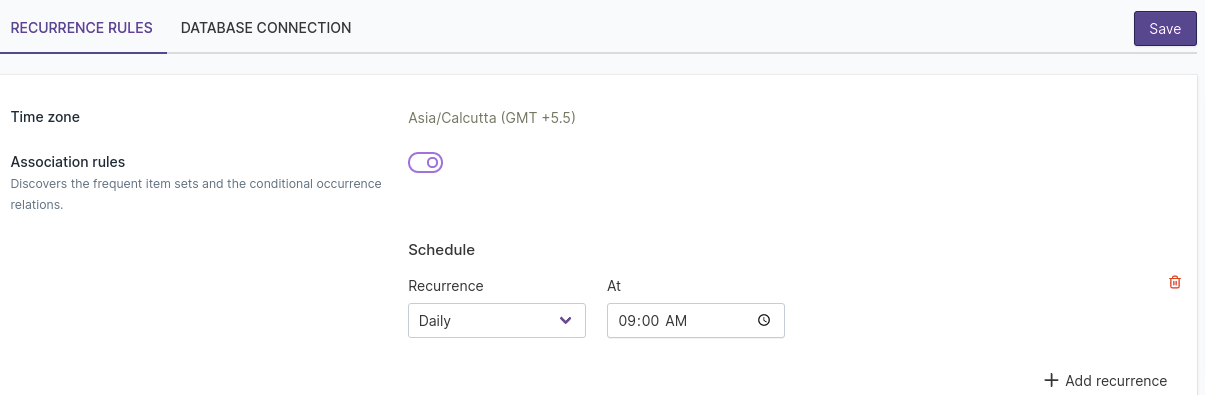
Recurrence settings determine how often Qbo should compute analytics using configurations on the entity level.
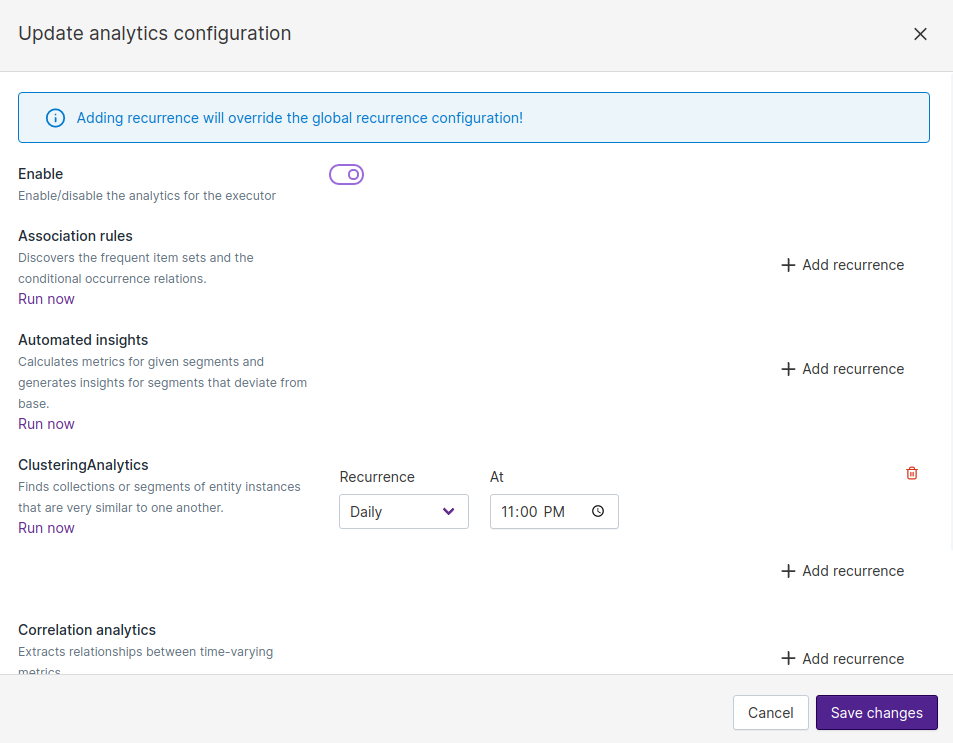
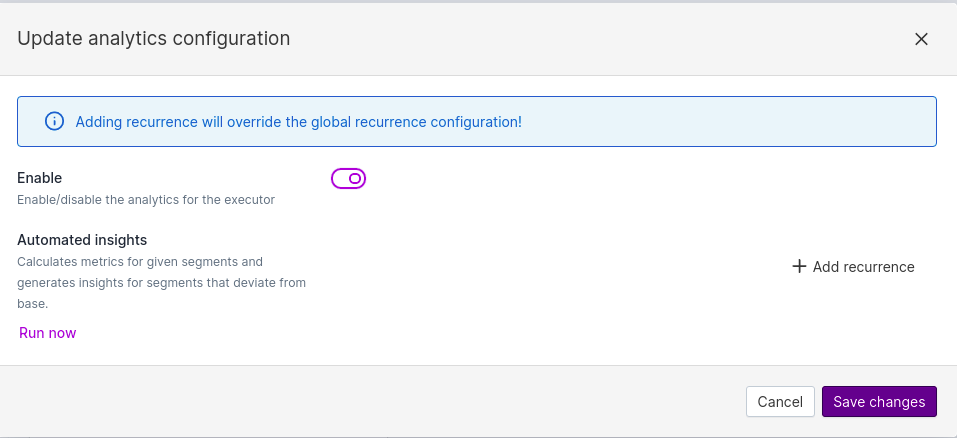
Define the recurrence parameters using settings available in the data source. To set the recurrence, click Update analytics configurations.
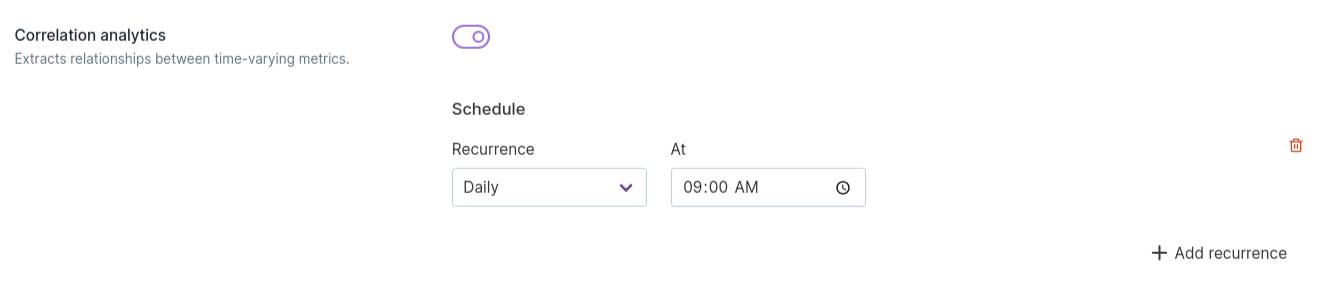
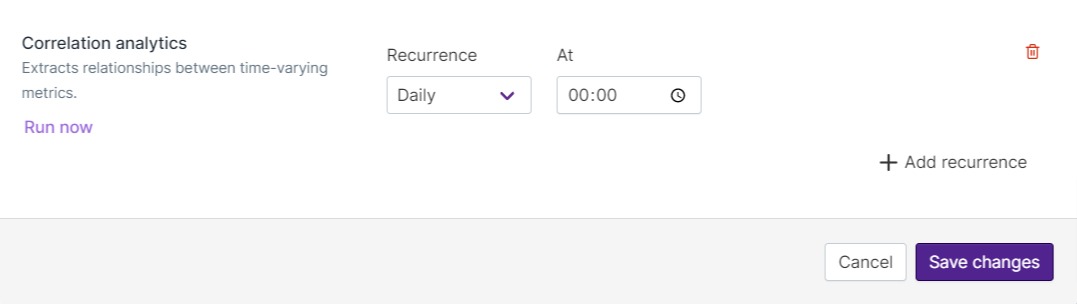
To enable analytics on the data source, click Enable and add recurrence to any of the available options. Visible options have been previously configured.
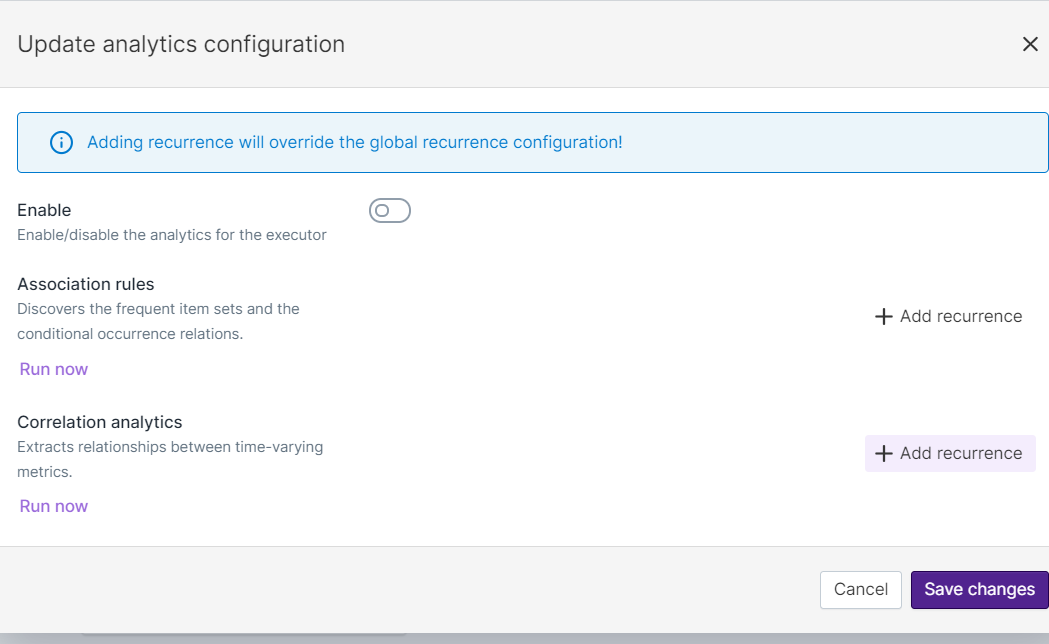
In this example, the recurrence is set for Correlation Analytics, but this can be configured for other
analytics as well. Select the recurrence time and frequency to refresh the correlation analytics configuration.
Running analytics
Once configuration is complete at the global and data source levels, run the analytics from Qbo’s UI.
Click the Run now button on the Update analytics configuration page.
When the analytics have run successfully, you can query the data.
Analytics configuration
Qbo can perform analytics which can be categorized as:
Descriptive: What happened? - variance and correlation queries.
Diagnostic: Why did it happen? - automated insights and clustering.
Predictive: What will happen? - association rules and forecasting.
Prescriptive: What should we do about it? - inventory optimization.
A key design direction for Qbo is that analytics must be configurable by users without any coding, and without necessarily needing deep knowledge of machine learning or statistics. We believe this will make analytics accessible to a much larger segment of users.
With this goal in mind, Qbo comes with several built-in algorithms for performing algorithms. Each of these algorithms have been tuned to be able to work on a wide variety of datasets. You can configure them to give direction to Qbo on various ways to explore the data that can lead to higher quality insights.
First, let’s define a few basic concepts related to analytics:
Metric: A measurable quantitative value in the dataset, like total count or average revenue. Metrics are usually computed by aggregating values from one or more attributes. In Qbo, metrics are also called named aggregates.
Dimension: Any attribute that can be used for grouping the entity. Usually, these are string attributes like city and product category. However, they can also be numeric attributes like age.
Variance Analysis
Variance analysis is a kind of diagnostic analysis that allows comparing the values of a metric (also called a behavioral aspect) between two different values of a dimension (also called a related aspect). It comes up with a diagnosis in the form of a list of key reasons that can best explain why the value of the metric differs.
Types of variance analysis
There are two common types of variance analysis:
Comparison based on a time attribute.
This is the most common kind of variance query, and is commonly used to analyze why some metric has increased or decreased in a given time period compared to some baseline. There are two different ways of defining the baseline:
Comparison of the value of a metric between two different periods of time. The different periods can be of different lengths of time; Qbo just warns about this and proceeds with the analysis. For example:
Compare the spent amount in the last 3 days with the previous 3 daysCompare the spent amount in the current week with the previous 3 daysCompare the spent amount in the last 3 weeks including this week with the previous 3 weeksCompare the spent amount in the last 2 months including this month with the previous 3 weeksCompare the spent amount in the current week with that in between 2016-08-01 and 2016-08-02Comparison of the value of a metric on a given time period with an average. The average is computed on the full dataset, and it can be a daily, weekly, monthly, quarterly or yearly average, depending on how the time period is defined. For example:
Compare the spent amount on 2016-07-18 with the average.Qbo compares the spent amount on a given day with the daily average over the whole dataset. In this case, the phrase “average” is interpreted as daily average by default.
Compare the spent amount in the last 2 quarters including this quarter with the weekly averageQbo compares the weekly average of the spent amount in the last 2 quarters, including the current quarter so far, with the weekly average over the whole dataset.
Comparison based on a non-time attribute.
This allows us to compare the value of a metric between different products, customers, regions or other non-time dimensions, and analyze the key factors behind the difference. For example:
Compare the spent amount of customer Maryjane Doyle with that of customer Tianna StanleyCompare the spent amount of customer "Maryjane Doyle" with that of customer Tianna StanleyA time period filter can be applied to these queries. For example:
Compare the spent amount of customer Maryjane Doyle with that of customer Tianna Stanley in the last 3 weeksCompare the spent amount of customer Maryjane Doyle with that of customer Tianna Stanley on or after 2020-04-10Diagnosis of Variance
Qbo explains the reasons for the difference in value of the metric across the two comparison points by looking at these possible explanations:
Related Aspects: Qbo digs into different dimensions or related aspects that are related to the metric, to identify the most significant values that explain the difference between the two values of the metric. It ranks each value of each dimension based on the absolute change, percentage change, and significance of the change in comparison to other values in that dimension. Qbo presents the top-k values across all available dimensions along with additional information about other related metrics. By default, it ranks the values of the dimensions based on the variance importance score, which is explained in the next section.
Component Aspects: Sometimes a metric can be expressed in terms of a product of two other attributes. For example, an attribute like
amountcan be expressed asprice * quantity. To diagnose the variance intotal amount, Qbo can diagnose it in terms of changes inpriceorquantityof individual items or individual values of each dimension (or related aspect). For example, thetotal amountmight have increased because thepriceof some products increased, or thequantitysold increased, or both.Correlated Metrics: Variance can also be explained by correlated metrics. Qbo uses the correlations discovered by correlation analytics to explain difference in the value of a metric. For example, if a metric like
total amountis found to be correlated withtotal number of employees, Qbo will use this information to help explain variances intotal amount.
Variance Importance Score
Qbo uses a novel approach based on a “variance importance score” to help rank the top reasons why a metric might vary. In order to explain the variance importance score, let’s state the problem a bit more mathematically.
Let’s say we have a metric \(M\) (like total amount) and two dimensions \(D_1\) and \(D_2\) (such as
city and product). Let’s use \(\Delta M\) to refer to the difference in the value of \(M\) between
the time-period of non-period dimension values we are comparing. Further, we’ll use \(\Delta M (D_1 = a)\) to
refer to change in the value of a metric for the dimension \(D_1\) being \(a\) .
The variance importance score captures two main ideas :
Absolute change in metric for a given values of a dimension: A value of a dimension for which the metric has a large absolute change should be given a higher rank than one that has a lower absolute change. That is, for a given \(a \in D_i\) and \(b \in D_j\), if \(\Delta M (D_i = a) > \Delta M (D_j = b)\), then \(a\) should be higher ranked than \(b\)
Significance of change in metric compared to all values values in a dimension: If all values of a given dimension have a relatively similar change in the value of a metric, that is not very interesting. However, if one of the values of a given dimension has a big change compared to other values, then that is more interesting, and should be ranked higher.
Elements of variance analysis configuration
Data source & placeholders
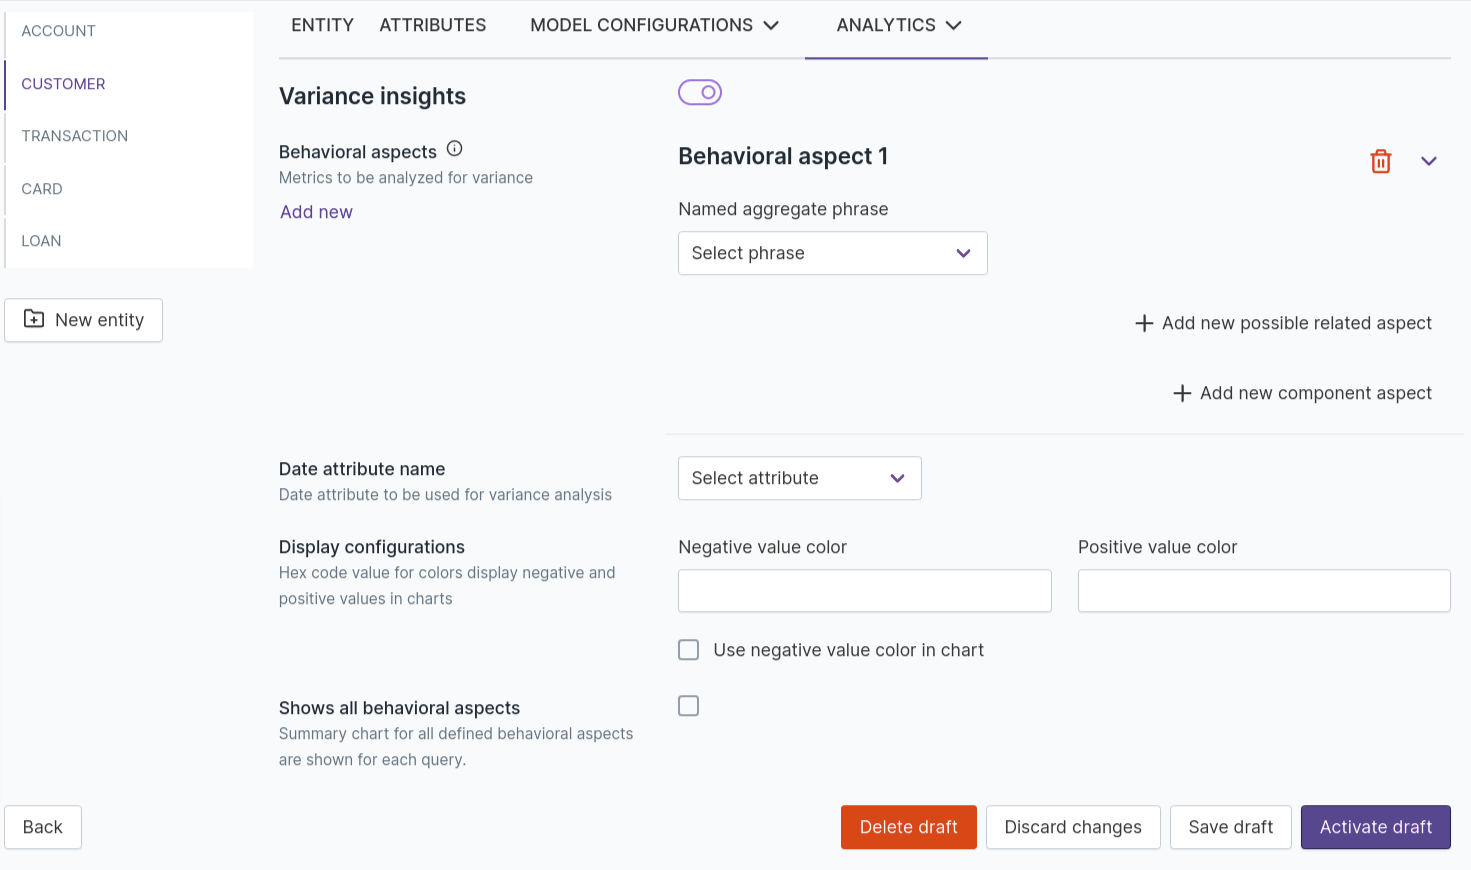
Entity name: This field is auto populated. It indicates the name of the entity.
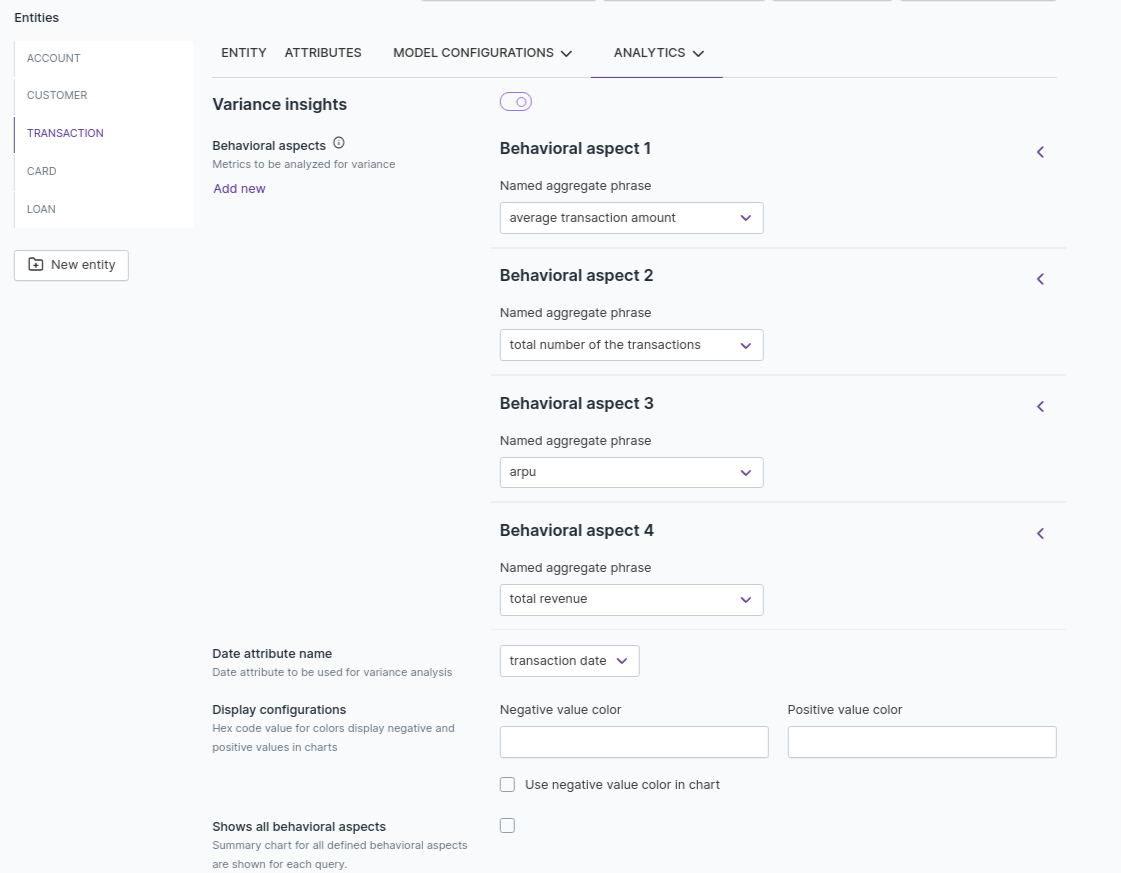
Date attribute name: If an entity has one or more attributes with
dateordatetimedata type, you can use this to select the attribute that will be used for enabling temporal analysis. This field is optional. For example, in the insurance domain, if you are configuring a policy entity then you can choose the policy issue date as date attribute which will help to ask various questions based on count of policies issued monthly or yearly.Shows all behavioral aspects: If this is enabled, Qbo generates a summary report for all defined behavioural aspects as well as corresponding component aspects. If disabled, Qbo generates a report for an individual behavioural aspect. This field is optional.
Behavioral aspects
Named aggregate: Any business KPI configured in the entity as named aggregate can be used in variance configuration. Variance will be computed for the named aggregate between two time periods or between two categorical attributes. For example, you need to check the number of policies issued weekly or monthly. You create a named aggregate for the number of policies issued, which performs a count aggregate operation on the policy table by checking the issue status of each policy. To configure the variance, configure at least one named aggregate for the entity and enter it in this field. You can add as many named aggregates as needed. This field is mandatory.
Component aspect attributes: Select attributes on which you can perform aggregate function in component aspects. For example, if you need to analyse the total number of policies issued vs total policy amount, you can add policy amount as a component aspect attribute. You can add as many component aspects as you need. This field is optional.
Possible related attributes: Select attributes from the entity which you want to explore for further analysis. For example, if you need to explore the count of policies issued with the help of attributes company name, policy status, policy type, and age group of customers, you can add these attributes to this section. This field is mandatory.
Component aspects
Attribute: Select attribute defined in component aspect attribute field corresponds to aggregate function defined in the behavioral aspects section. This field is optional.
Aggregation type: Select the aggregate function based on the type of operation you want to perform - for example, Average, Count, or Sum. This field is optional.
Primary related attribute: Select the primary attribute which will uniquely identify the attribute field. For example, price is dependent on product ID; policy value is dependent on policy type. This field is optional.
Example
Go to the VARIANCE INSIGHTS section of the entity for which you do variance analysis.
If Date attribute name is provided, time based comparison will be enabled.
Configure Behavioral aspects and select
Possible related attributesby selecting attributes from the drop down.If
Component aspect attributeis assigned in the Behavioral aspects section, configure the Component aspects section and perform necessary operations on component aspect attribute based on corresponding named aggregate.
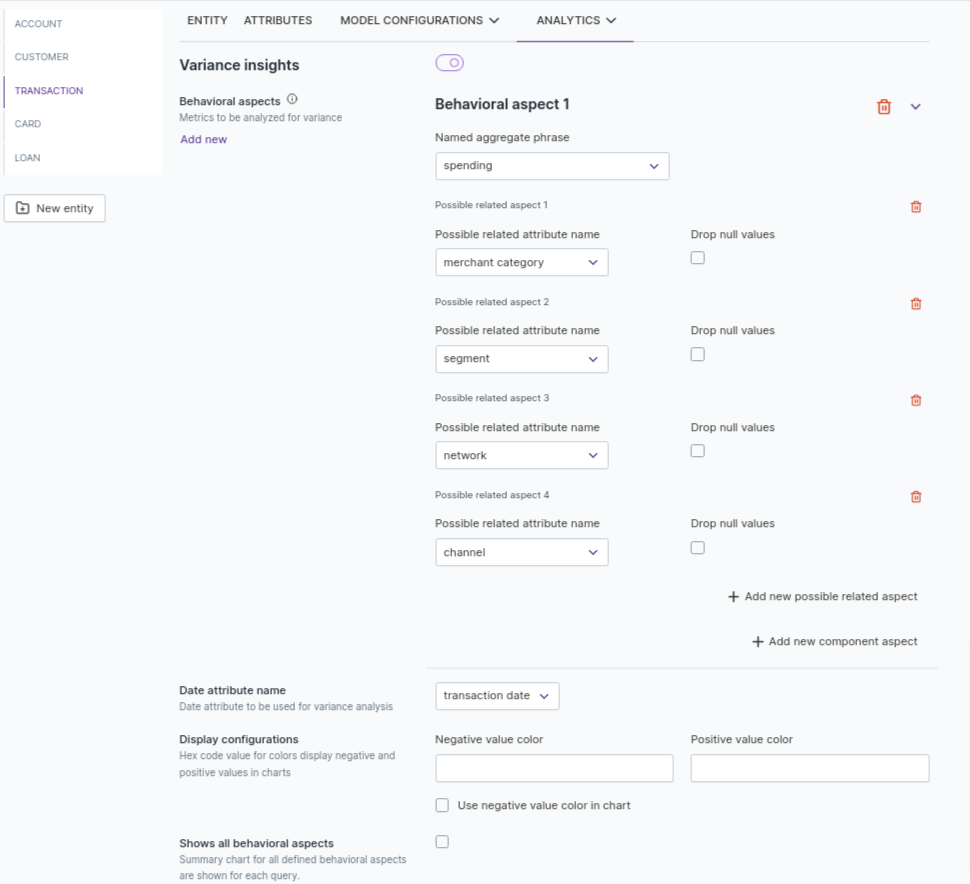
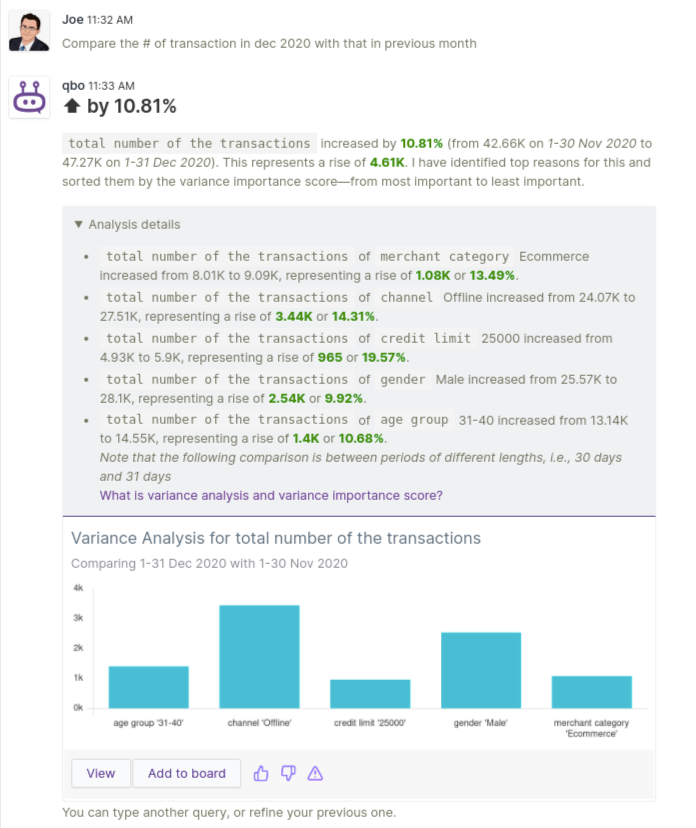
For entity transaction, metrics (Behavioral aspects) spending, total revenue and
total number of the transactions can be compared over various dimensions (Possible related attributes)
and component aspects. For example, matrix total number of the transactions compared over dimensions
merchant category, age group, credit limit, channel, status, gender and assigned component
aspect attribute as amount by performing Sum aggregate operation in component aspects. This allows you to
compare total number of transactions vs total amount.
User Joe is able to compare the total number of the transactions over defined Possible related attributes.
Note
Named aggregates can be used as variance behavioral aspects. There are some restrictions on the named aggregates that can be used as variance behavioral aspects.
Aggregation functions are Average, Count, Distinct count, Maximum, Minimum, Population standard deviation, Population variance, Standard deviation, Sum, and Variance.
All attributes having the attribute type string, integer, and location name can be regarded as Possible related aspects.
For manually added behavioral aspects, the querybot validates that the names of the behavioral aspects are the same as a named aggregate phrase of the same entity. If a named aggregate phrase is found that is equal to a behavioral aspect name, it validates that the behavioral aspect has the same attribute name, the same aggregation type(behavior), and the same normalizer of that named aggregate.
Automated Insights
Automated insights is an analysis where Qbo digs for valuable insights within data. Segments across different dimensions are compared to find the best or worst performers for given metrics.
Global configuration
Go to Analytics in the Configurations section. Enable Automated insights, schedule recurrence, and click the Save button. Qbo will run the insight generator at the scheduled time in the backend.
Entity level configuration
Go to the Analytics section and select Automated Insight from the drop down for the entity.
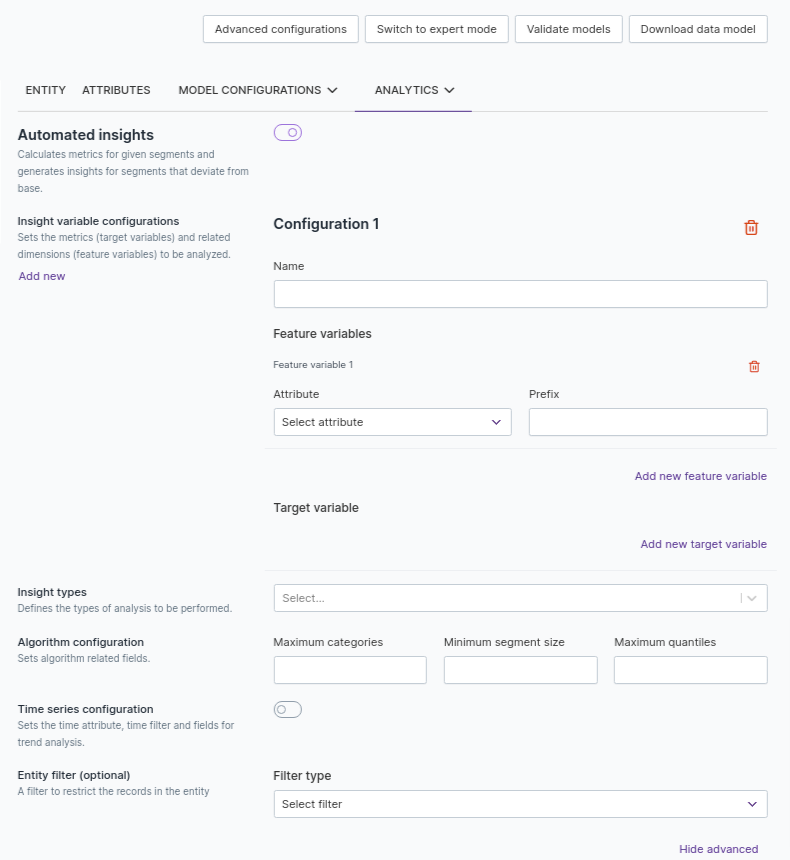
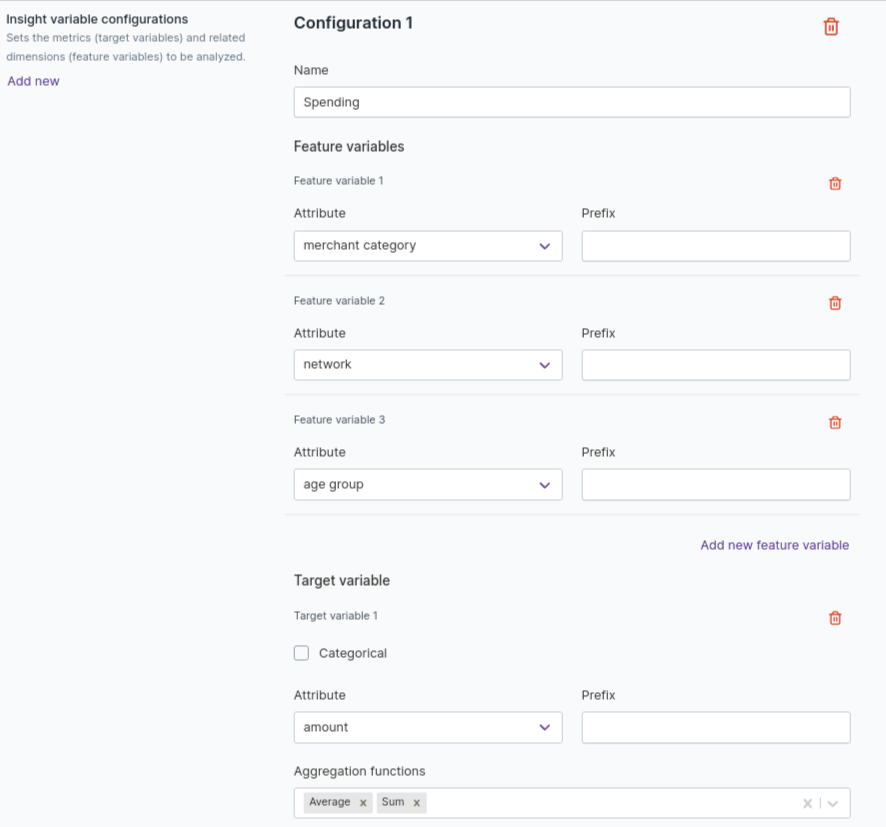
Insight variable configuration: Contains sets of metrics (target variables) and related dimensions (feature variables) to be analyzed.
metrics: Any measurable quantitative value in the dataset like amount, revenue, id, spend. Metrics are usually computed by aggregating values from one or more attributes.dimensions: Any attribute that can be used for grouping the entity. Usually, these are string attributes like city, age group, category, etc.
Feature variables: Click Add new feature variable to add dimensions.
Target Variable: Click Add new target variable to add metrics, and add
Aggregation functions.
Note
Categorical attributes like String and LocationName can also be used as metrics. If the Categorical checkbox is checked, Qbo treats target variable like a categorical metric, which means a percentage for each value for that attribute is calculated and used as the metric.
Algorithm configuration:
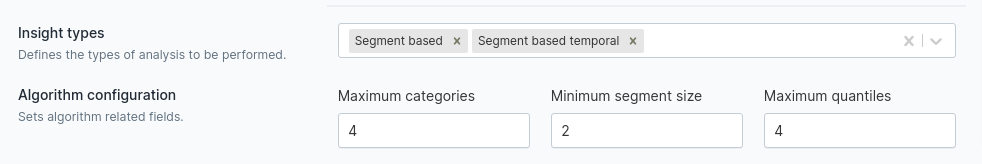
Maximum categories: Number of categories in a feature variable (dimension) used for generating segments. Default value is 50.
Minimum segment: Minimum number of rows a category must have to be considered. Default value is 10.
Maximum quantiles: Number of quantiles for non-categorical feature variables. Default value is 10.
Insight types: Automated insight offers
Segment based,Segment based trend,Segment based seasonalityinsights.
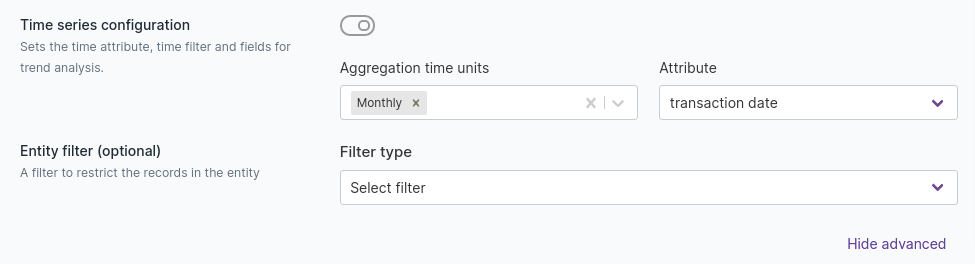
Time series configuration: Enable to set the time attribute, time filter, and fields for trend analysis.
Aggregation time units: Select time unit as Year, Month, and Day.
Attribute: Set date attributes for trend analysis.
After adding all the configuration, click the Save automated insight as draft button to save automated insight changes.
Click the Save draft button and click the Activate draft button to save your changes.
On executor, click on the vertical ellipsis (3 dots), click Update analytics configurations, and enable Automated insights. Click + Add recurrence and add your automated insight scheduled recurrence. Click the Save changes button.
Reload your Qbo instance to make your automated insights available.
After successful reload, you can ask queries like:
Show insights,Show segment insights,Show seasonality insights,Show trend insights,show first 5 insights
Follow auto-suggestions for automated insight queries.
Correlation Analytics
Correlation analytics extract relationship between time varying attributes. Qbo can analyze relationships between two or more metrics across similar or different attributes in an entity.
Select the correlation analytics options from the Analytics drop down menu and open the configuration.
Configure Correlation Analytics
Correlation analytics run on multiple entities when executed. Set the configuration for each entity at the entity level.
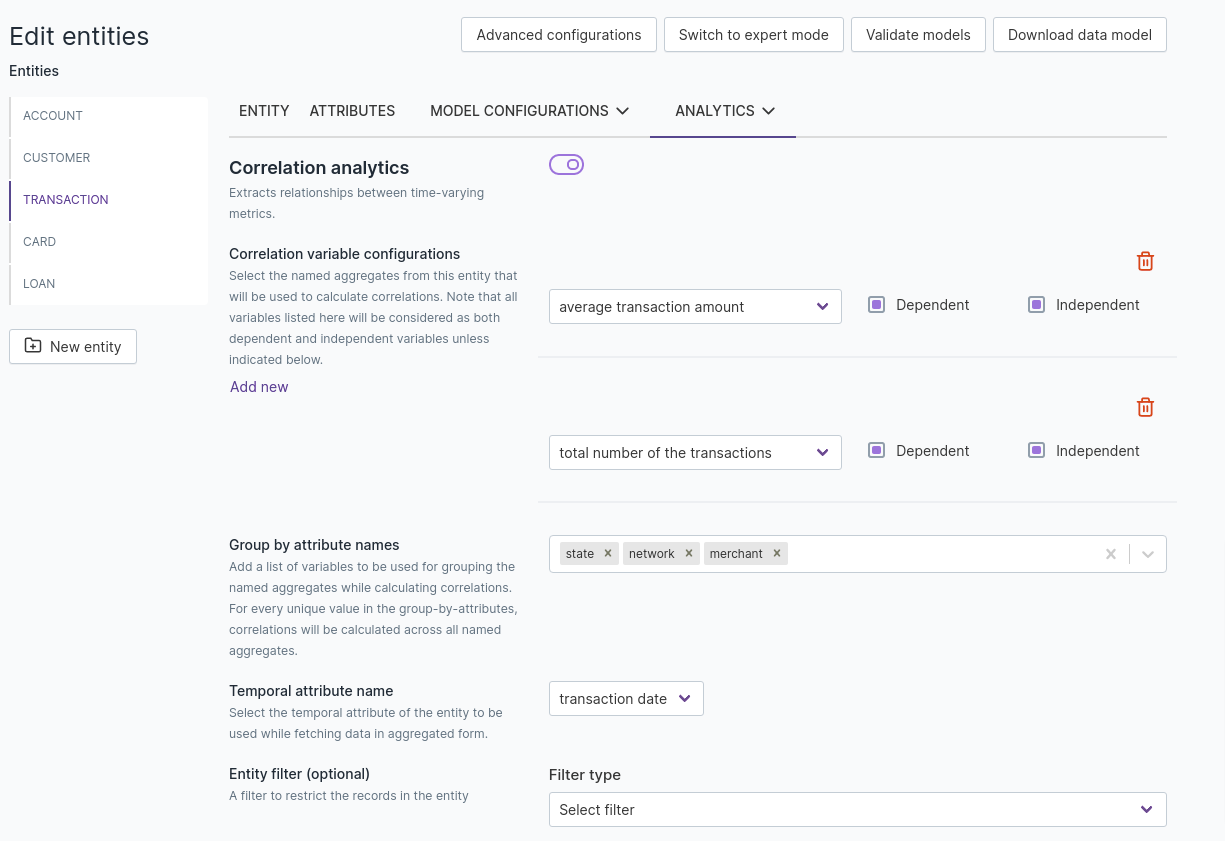
Correlation variable configurations: The variable configurations need the named aggregates on which correlations are to be calculated. Select the pre-configured named aggregates for the entity.
Group by attribute names: The attribute names to group the named aggregates while calculating correlations. The correlations will be calculated for each unique group by attribute value of the group by attribute names. Select the attributes against which the correlations would be calculated for the named aggregate(s).
Temporal attribute name: Temporal attribute of the entity to be used in fetching the data in aggregated form. This attribute will be used to join different entities for correlation calculations. Select the temporal (DateTime or Date type) attribute that Qbo will use when calculating the correlation between the named aggregates.
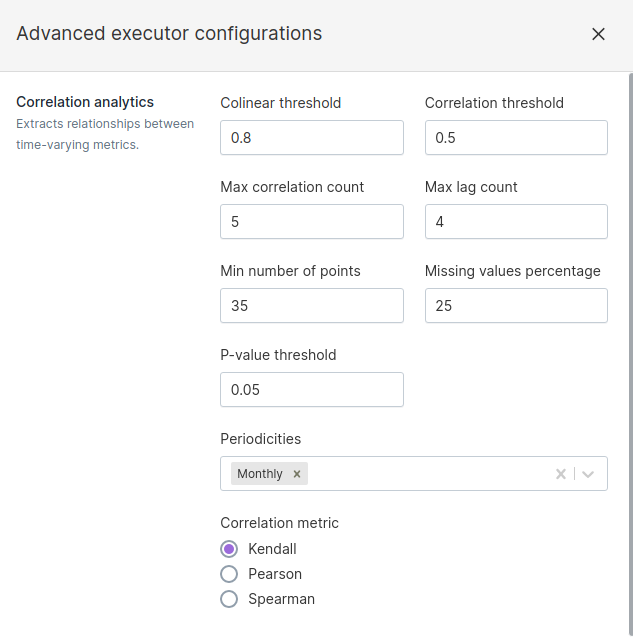
Once you’ve completed the basic configuration, click Advanced Configurations at the top and set all parameters as described. These are the executor level settings for correlation analytics that are applied to all entities.
Colinear Threshold: Provides the limit for colinear filtering of correlations. For example, X is correlated with Y with correlation score 0.8 and X is correlated with Z with correlation score of 0.9. If Y is correlated with Z with a correlation score over the colinear threshold, only corr(X, Z) will be added to the output table, as it is higher than corr(X, Y). If corr(Y, Z) is below the colinear threshold, both corr(X, Y) and corr(X, Z) will be added to the correlations table.
Correlation Threshold: Defines the minimum correlation score required for an output.
Max correlation count: Defines the maximum number of correlations for a variable.
Max lag count: Correlations between two variables are calculated with lags. The one with best correlation score is chosen. Max lag count specifies the limit for the lag to make correlation calculations.
Min number of points: Threshold for minimum number of points required for the correlation analysis. If a segment has fewer samples (non-null) than this value, it will be ignored.
Missing value percentage: If there are more than missing value percentage null values, missing values will be dropped and correlations will be calculated. Otherwise, they will be filled with 0.
P-value threshold: Provides the threshold for the significance of the correlations. It is usually set at 0.05; that is 95%.
Periodicity: Provides the list of periodicities to calculate correlations. The temporal attribute will
be aggregated according to the periodicities in the list. The periodicities can be Daily , Weekly, Quarterly ,
Monthly, or Yearly.
Correlation metrics: Select one of: Kendall, Pearson, or Spearman.
Sample Queries: Test the configuration by asking Qbo questions like What are the correlation insights? or What are the correlation outputs?
To set up recurrence of correlation analytics, see Overall Analytics Framework.
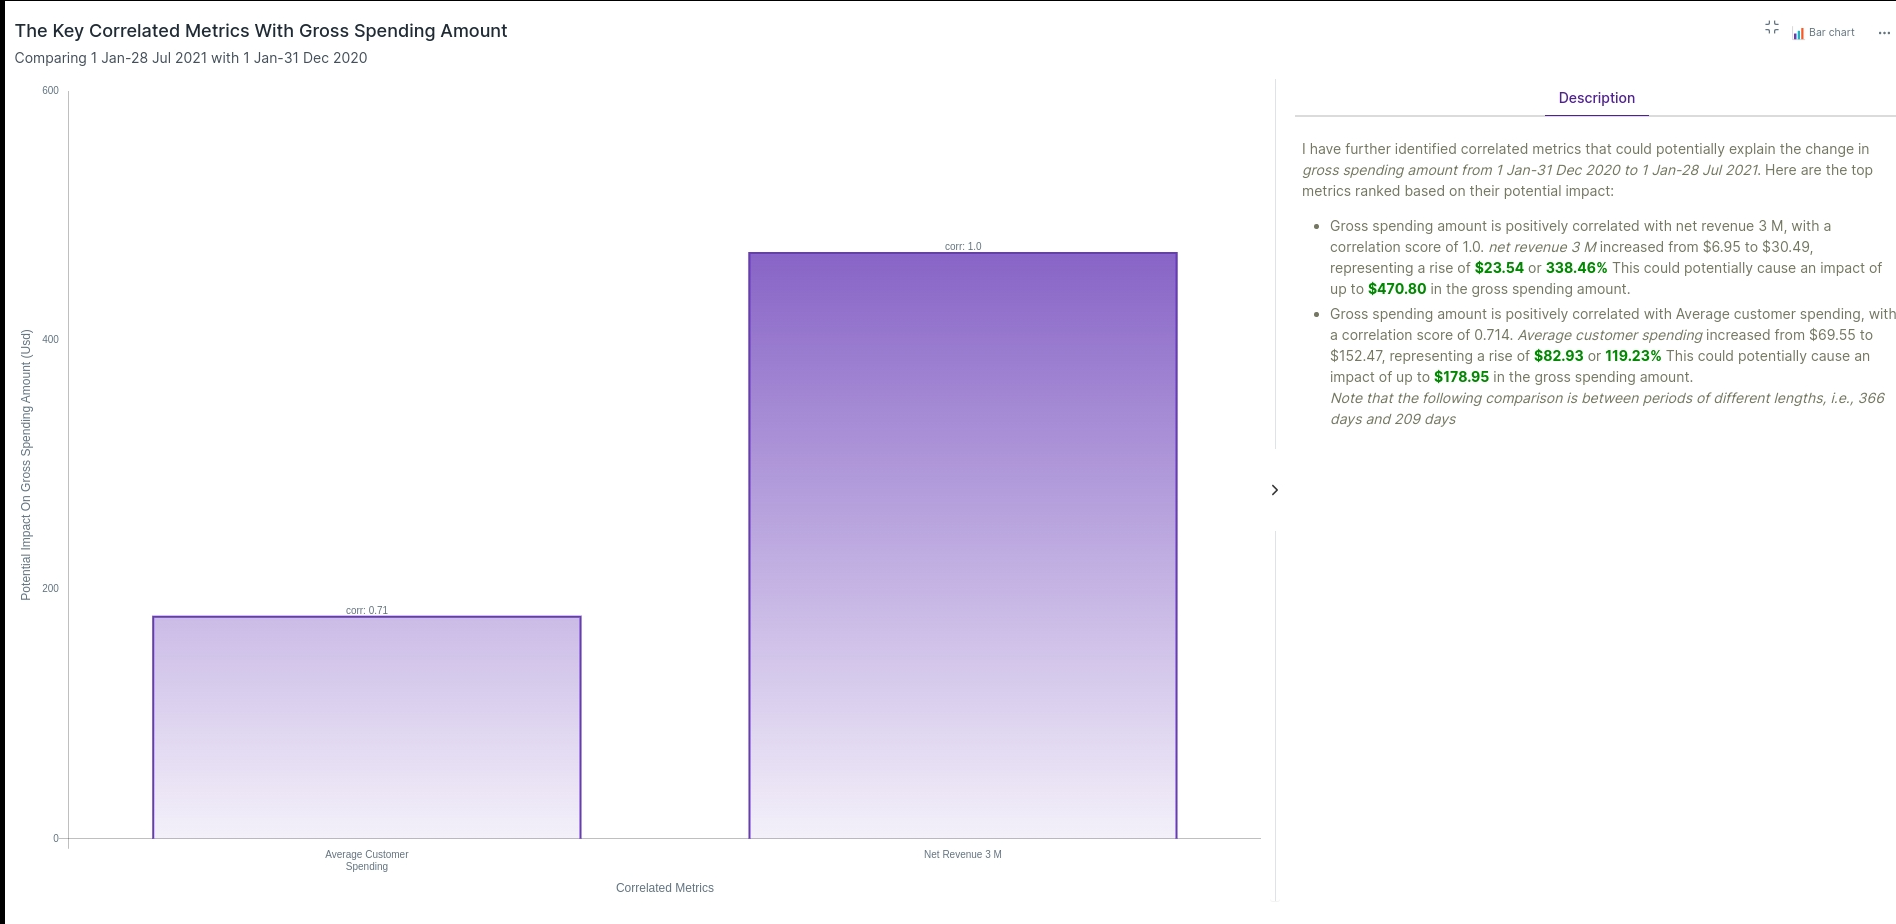
Variance with Correlations
Qbo can analyse the correlation of business KPIs with key dimensions. It identifies the top 3 valid correlations, based on correlation score and business KPI. Correlation score will indicate percentage of predicted correlation for business KPI.
To generate these analysis reports, perform configuration in the Analytics section. Define required business KPIs in the Variance insights and Correlation analytics section. For example, to define business KPI gross spending amount:
Variance insights configuration:
Correlation analytics configuration:
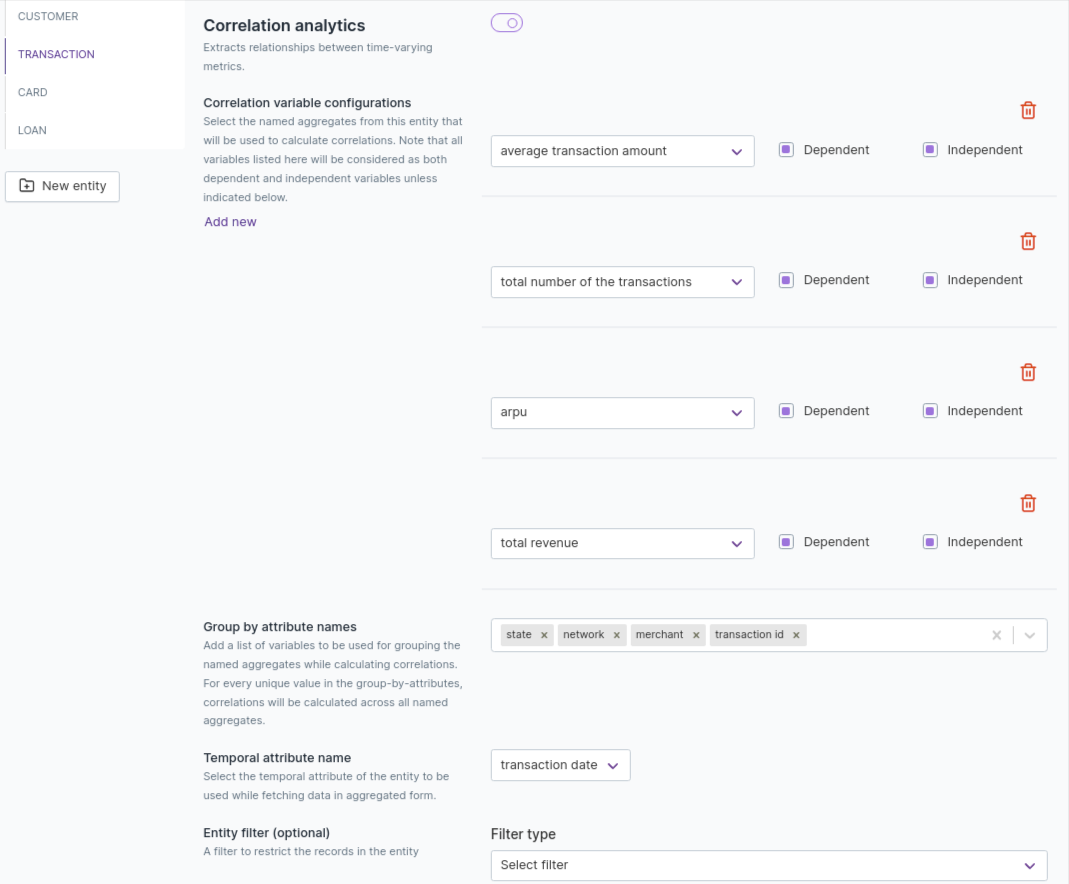
After completing configuration, save and activate the draft. Then reload the bot to activate the changes.
Go back into the conversational thread and check that correlation insights are generated successfully. If results are not generated, Qbo will not be able to analyse variance with correlation.
Correlation insights results:
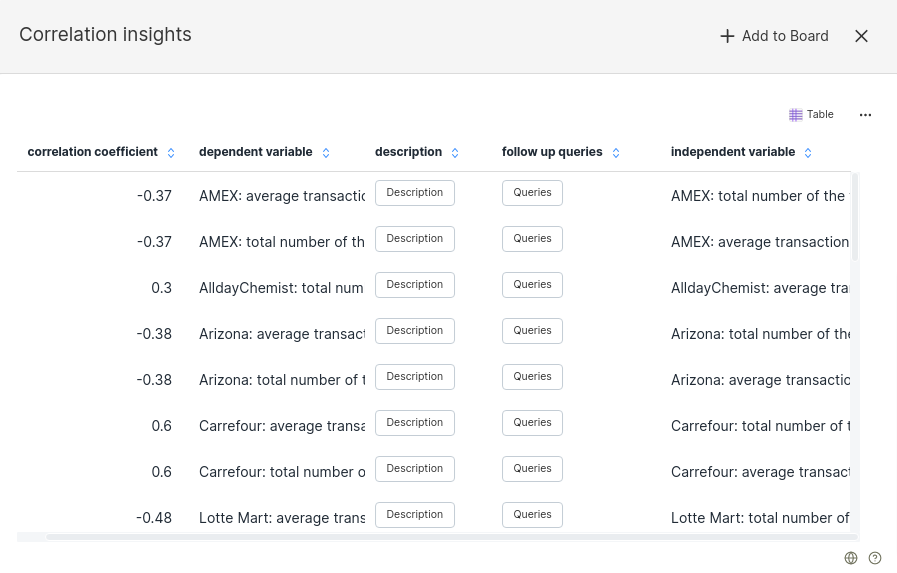
Correlation insights are generated successfully. Ask a variance query which compares the gross spending amount in this year with the previous year. Qbo will provide results:
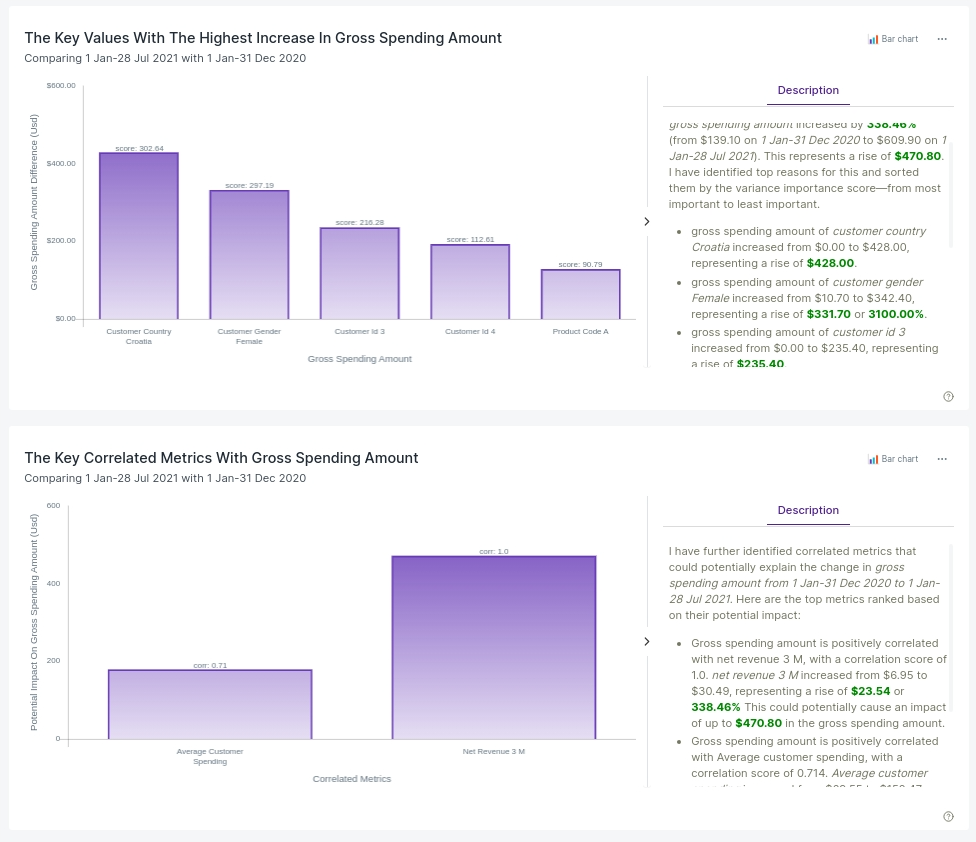
Go to the second section in the chart shown above. You will see variance with correlation results:
Association Rule
An association rule is an If... then statement that shows the probability of relationship between data items.
It shows how the occurrence of the antecedent (if) effects the occurrence of the consequent (then).
For example, an antecedent: toothbrush; and consequent: toothpaste.
A rule having these attributes will show how buying a toothbrush (if) has an effect on buying toothpaste (then).
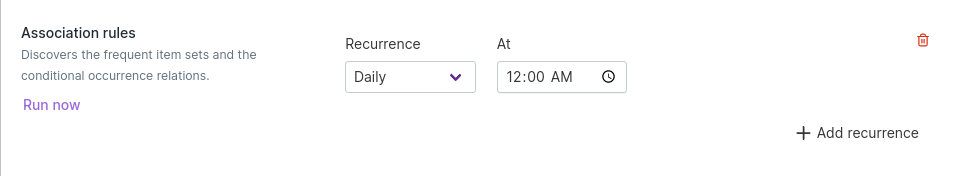
Select Association rules from the Analytics drop down and access the configuration:
Configuration
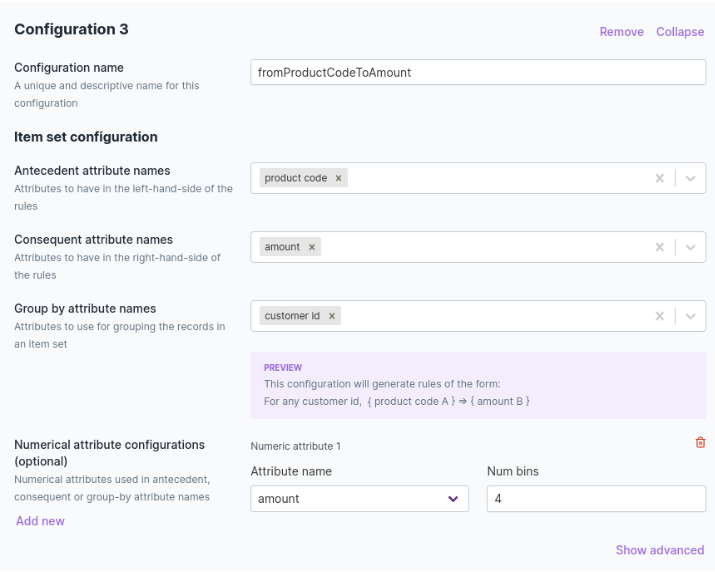
Configuration name: A unique and descriptive name for this configuration.
An association rule has two parts: an
antecedent(if) and aconsequent(then).Antecedent attribute names: Attributes to have in the left side of the rules.
Consequent attribute names: Attributes to have in the right side of the rules.
Group by attribute names: Attributes to use for grouping the records in an item set.
Numerical attribute configurations (optional): If any of the antecedent or consequent attributes are continuous, add a numerical attribute configuration which will discretize them.
For example: Age, 4 bins: 0-20, 20-40, 40-60, 60-80, …
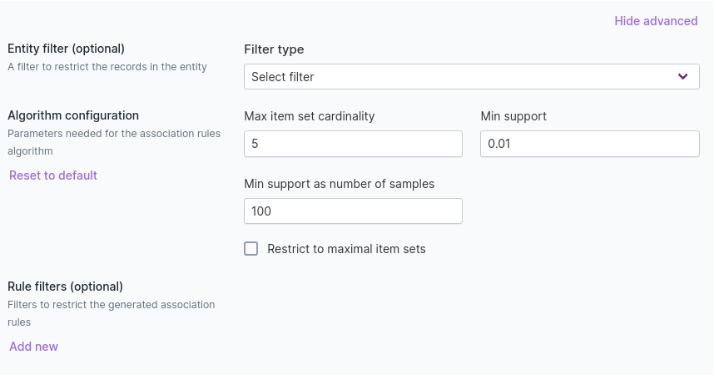
Entity filter: Any type of filter to restrict the samples in the entity.
Max itemset cardinality: Max number of items in a rule.
For example, when it is set to 2:
Product code A –> Amount 0-20 is possible rule whereas,
Product code A&B –> Amount 0-20 is not possible as cardinality is 3.
Min support: Minimum percentage of association to be present over all data to be considered as a rule.
Min support as number of samples: Minimum number of samples required for an association to be considered as a rule. Min support for the association rules algorithm is calculated as:
N = 1000 samples
min support = 0.1
min support as samples = 50
min support used in the algorithm = max(min support * total number of samples, min support as samples)
For this case, max(100, 50) = 100 So we expect at least 100 occurences of the association.
Setting recurrence in the executor
The recurrence settings determine how often association rules are computed using the association rules configuration.
Define the recurrence parameters using settings available in the executor.
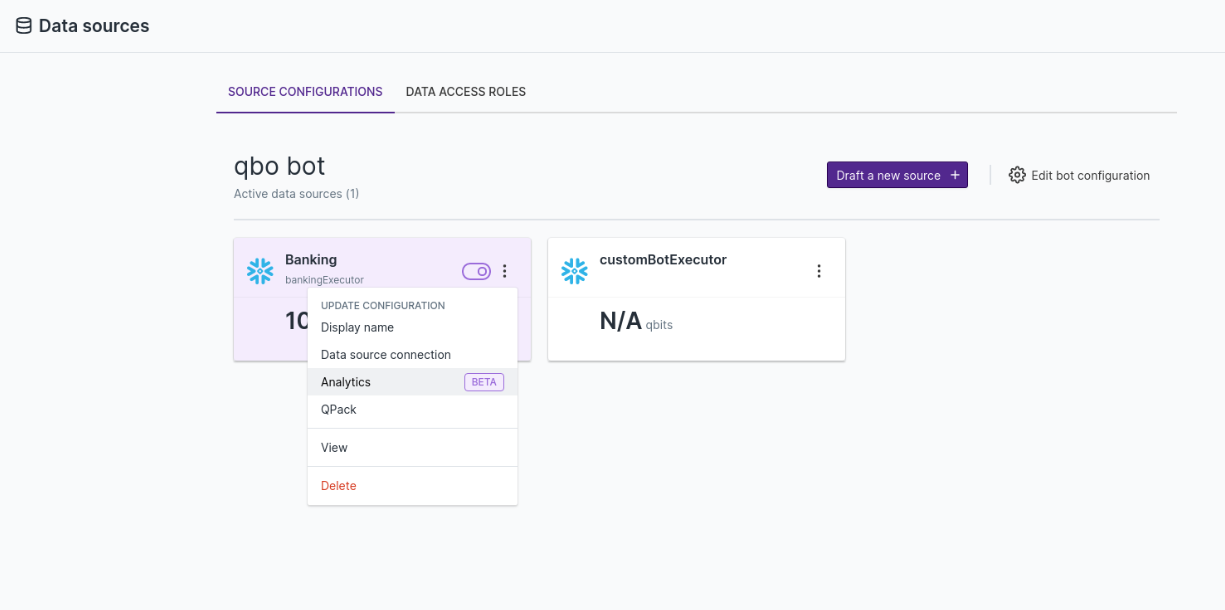
To enable analytics on the executor, select Enable and add recurrence to association rules.
Select the recurrence time and frequency to refresh the association rules configuration.
Qbo creates a separate table to store the association rules analytics output.
To connect to the database and get access to the table, select Analytics in the Settings page.
Input the data source connection details and credentials.
Clustering Analytics
Clustering is a process of grouping a set of objects in such a way that objects in the same cluster are more similar to each other than to those in other clusters.
Global configuration
Go to Analytics section. Enable ClusteringAnalytics, schedule recurrence, and click the Save button. It will run analytics_data_generator for clustering analytics at the scheduled time in the backend.
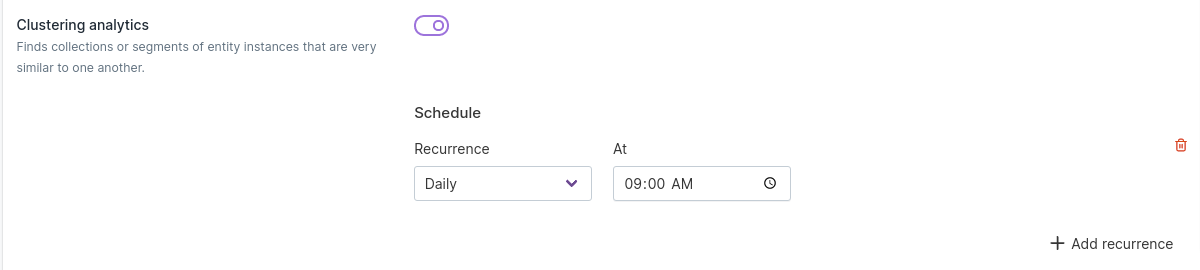
Entity level configuration
Select Clustering analytics from the Analytics drop down.
There are two types of clustering:
Feature based clustering: Clusters data according to features in the configuration.
RFM based clustering: Clusters data according to RFM features: Recency, Frequency, Monetary value.
Configure Feature based configuration, RFM configuration, or both.
Configuration name: A unique and descriptive name for this configuration.
Entity filter: Any type of filter to restrict the analyzed samples in the entity.
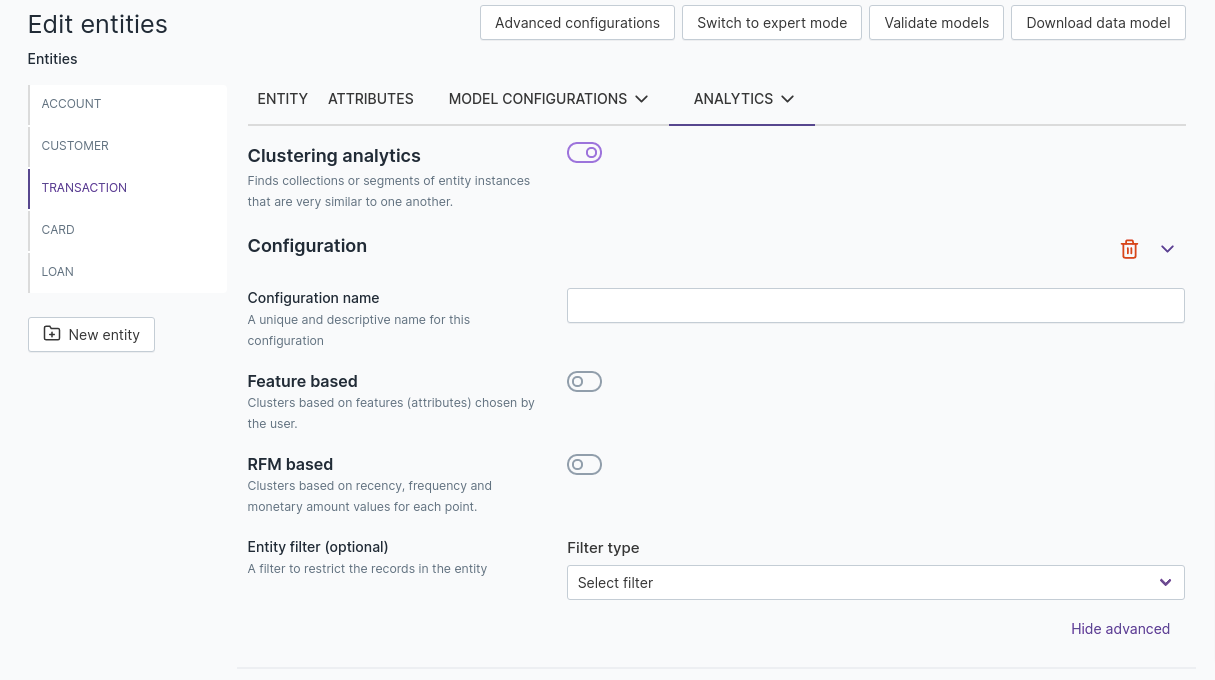
Feature based clustering configuration
Group by attribute: Target attribute to cluster on.
Variable configurations: Features contain list of attribute names or named aggregates.
Number of clusters: Number of clusters to be generated. Enter an integer 2-10. If it is not set (set as None), Qbo will decide the cluster count automatically.
Attribute name
If you select the attribute name approach, group by attribute (target attribute) should be primary key attribute.
For example, if you want to cluster customers based on their properties, set the clustering analytics configuration in the customers entity with customer number (primary key) as the group by attribute.
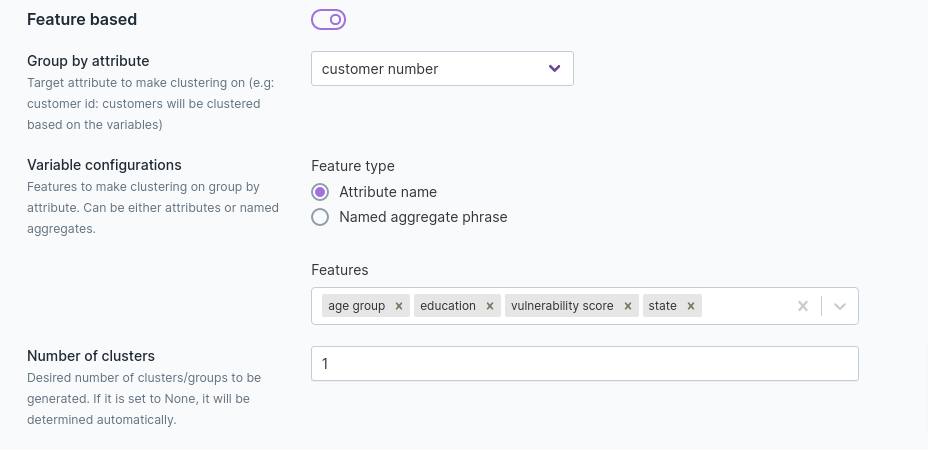
Named aggregates phase
If you select the named aggregate phase approach, group by attribute (target attribute) should be aggregated for clustering.
For example, if you want to cluster customers based on transactions they made, set the clustering analytics configuration in the transactions entity with customer number as the group by attribute.
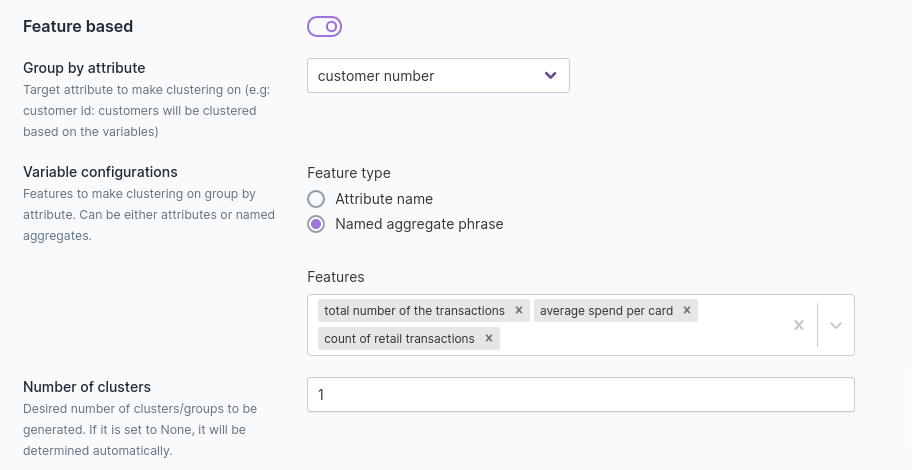
RFM clustering configuration
Group by attribute: Target attribute to cluster on.
Variable configurations: Variables for RFM analysis. Can be either attributes or named aggregates.
Recency feature: Attribute name or named aggregate having the time-based properties of the target attribute (datetime, date, composite date). For the named aggregate based approach, the named aggregate should have maximum as the aggregation function, giving the closest date.
Frequency feature: Attribute name or named aggregate specifying how frequently the target attribute completes an action (datetime, date, composite date).
Monetary feature: Attribute name or named aggregate showing how much is spent by the target attribute.
Algorithm configurations:
Number of clusters: Desired number of clusters or groups to be generated, between 2 and 10. If it is not set (set as None), the cluster count will be determined automatically.
RFM Quantiles: Quantiles can be set to 3, 4, or 5. Quantiles the recency, frequency, and monetary value attributes according to this number. Recency, frequency and monetary value will be binned into n rfm quantiles.
When it is set to 3, recency will be binned to low, medium, high.
When it is set to 4, recency will be binned to very low, low, high, very high.
When it is set to 5, recency will be binned to very low, low, medium, high, very high.
Periodicity: Recency is calculated according to the periodicity set. For example, if set to Monthly, recency will be calculated monthly.
Attribute name
If you select the attribute name approach, then the group by attribute (target attribute) should be primary key attribute with recency, frequency, and monetary value used as its feature.
For example, if you want to cluster customers based on their properties, set the clustering analytics configuration in the customers entity with customer number (primary key) as the group by attribute.
Named aggregates phase
If you select the named aggregate phase approach, the group by attribute (target attribute) should be aggregated for clustering based on recency, frequency, monetary value.
For example, if you want to cluster customers based on transactions they made, set the clustering analytics configuration in the transactions entity with customer number as the group by attribute, total number of transactions as frequency, spending as monetary value, and latest transaction as recency.
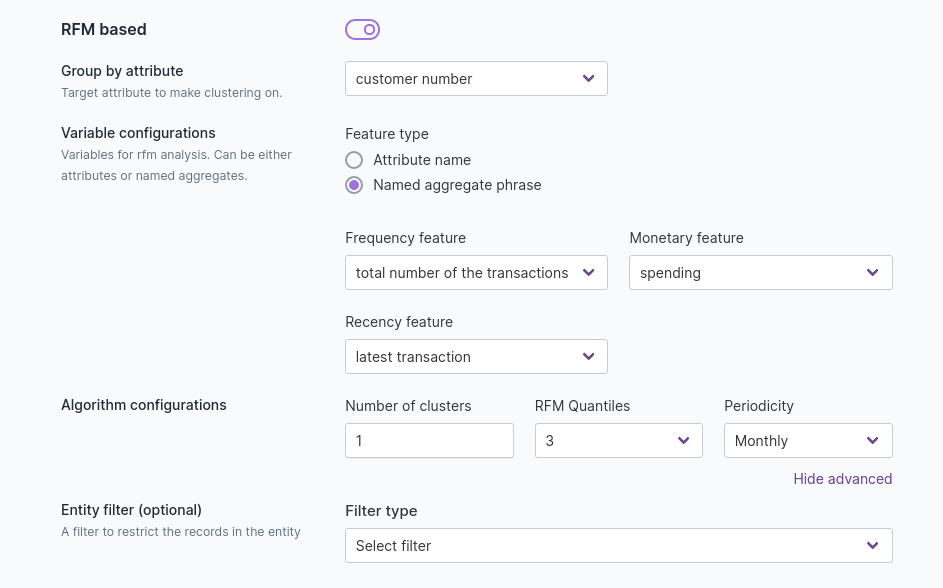
When you’ve completed configuration, click the Save draft button and click the Activate draft button to save your changes.
Click
 , select Analytics, click
Enable to enable ClusteringAnalytics, then click the Save changes button.
, select Analytics, click
Enable to enable ClusteringAnalytics, then click the Save changes button.
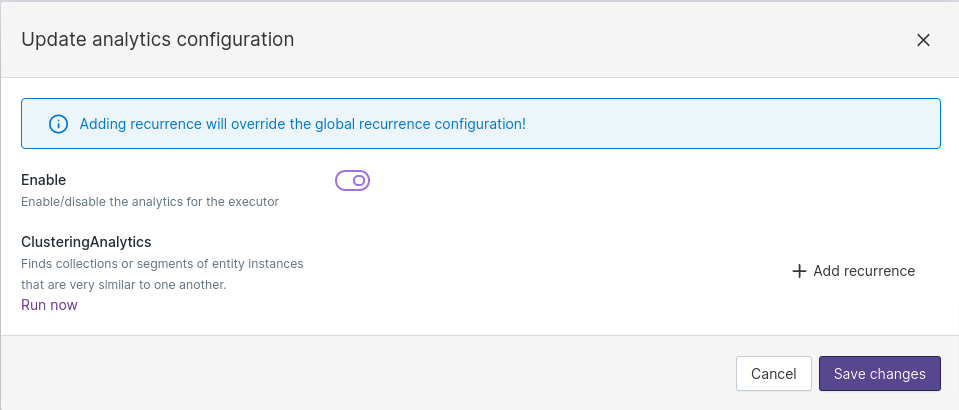
Reload your Qbo instance to make the clustering analytics changes available.
After reload, click the Run now button.
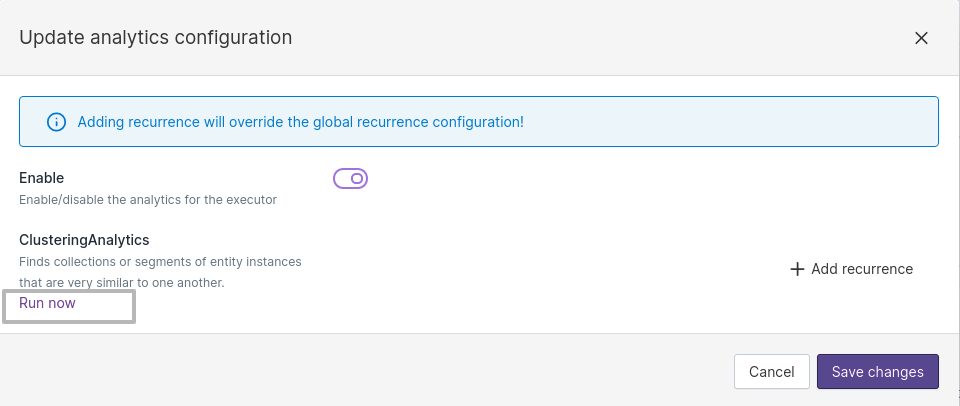
You can ask queries like:
What are the rfm items?What are the rfm clusters?What are the feature based clusters?
You can also follow auto-suggestions for clustering analytics queries.
Time Series Analytics
Time series analytics predicts the future values of named aggregates against a temporal attribute.
Global configuration
Go to Analytics under the Settings section. Enable Time series analytics, schedule recurrence, and click the Save button. It will run analytics_data_generator for time series analytics at the scheduled time in the backend.
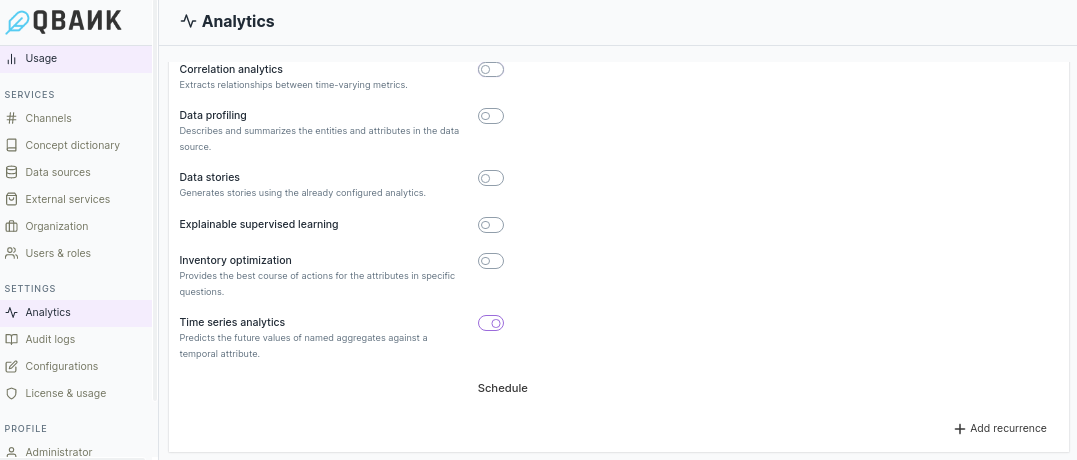
Entity level configuration
On the entity configuration, select Time series analytics from the Analytics drop down.
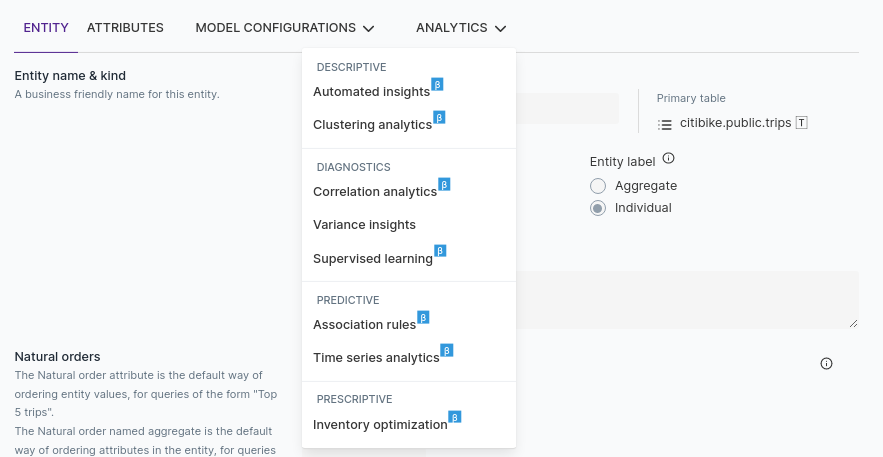
The following parameters are the basic configuration that you can set for time series analytics.
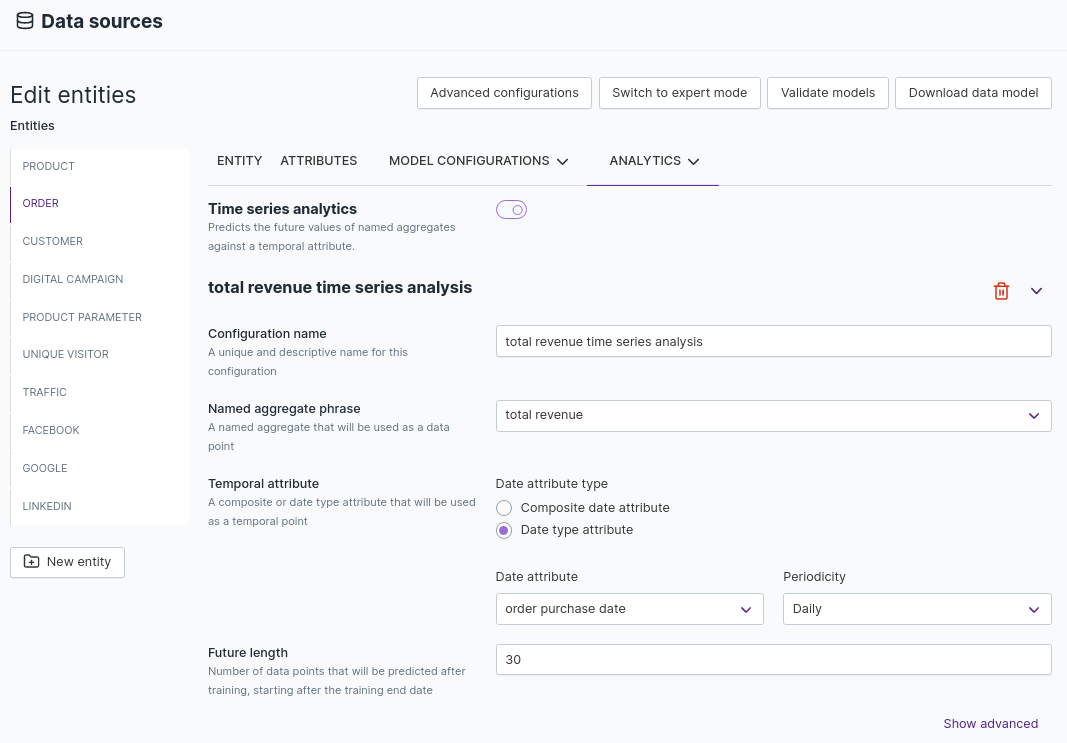
Configuration name: A unique and descriptive name for time series configuration
Named aggregate phrase: A named aggregate that will be used as a data point
Temporal attribute: A composite or date type attribute that will be used as a temporal point
Future length: Number of data points that will be predicted after training. Prediction will start from the training end date
Users can also configure the following advance parameters.
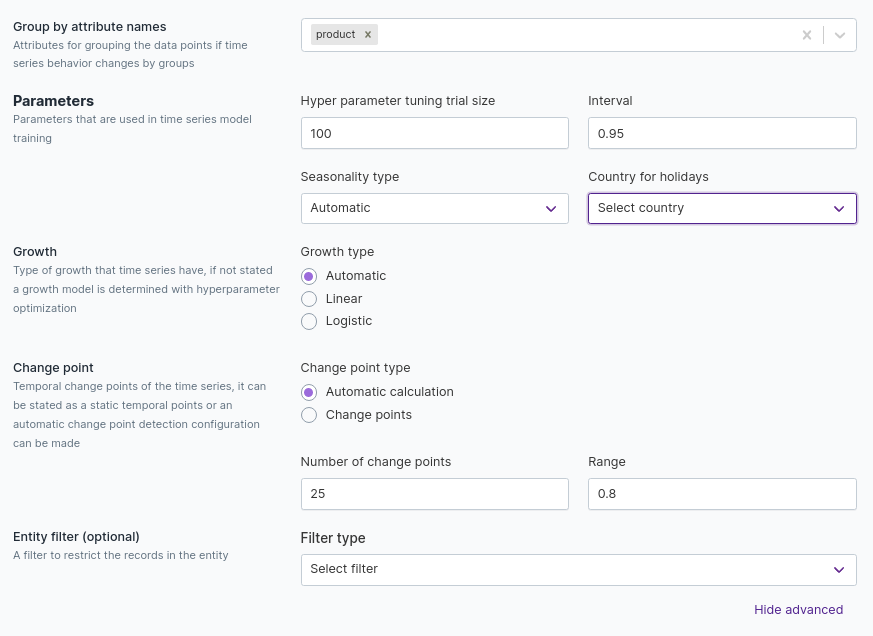
Group by attribute names: Attributes for grouping the data points if time series behavior changes by groups
Hyper parameter tuning trial size: Number of trials for cross validation in training phase to fit a model
Interval: Confidence interval limit to determine the upper and lower bounds of time series predictions
Seasonality type: Seasonality type can be additive or multiplicative. When additive seasonality type is selected, trend values add up to overall predictions. On the other hand, when multiplicative seasonality type is chosen, trend values will be multiplied to get the overall prediction value.
Country for holidays: Set the country code to include country holiday effects in time series
Growth type: Type of growth that time series have. If growth type is not stated, the growth model is determined with hyperparameter optimization. Use logistic growth model if you think the time series have maximum or minimum values
Change point type: Temporal change points of the time series, it can be stated as a static temporal points or an automatic change point detection configuration can be made.
Number of change points: Initial number of change points that algorithm will try to find
Range: Percentage of the time series that the algorithm will try to find change points
Entity filter: Set an entity filter to restrict the records that will be included in the time series analysis
Once time series configuration is complete, click the Save draft button and click the Activate draft button to save your changes. Reload your Qbo instance to make the time series analytics changes available.
Save, Deploy & Reload
While you are editing and making changes to entities, attributes, and their configuration in Data Source Configuration, you can decide to either keep or reject your changes. If you are keeping the modifications, you must reflect them in the conversations.
The cycle of managing revisions or modifications involves these steps:
Edit Draft –> Save Draft or Discard Changes –> Activate Draft or Discard Draft –> Reload
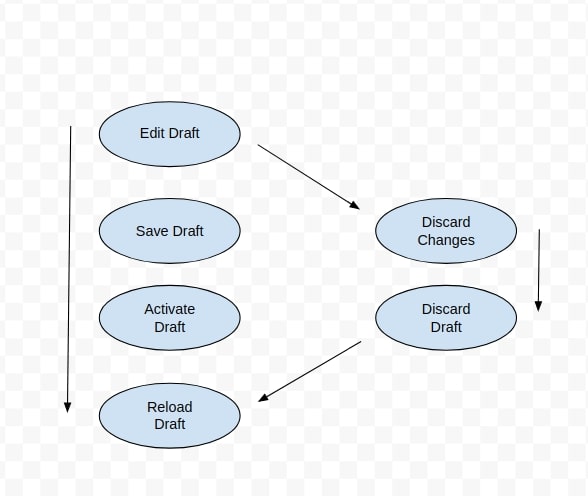
To do this:
Click the View option to view the data source you want to edit.
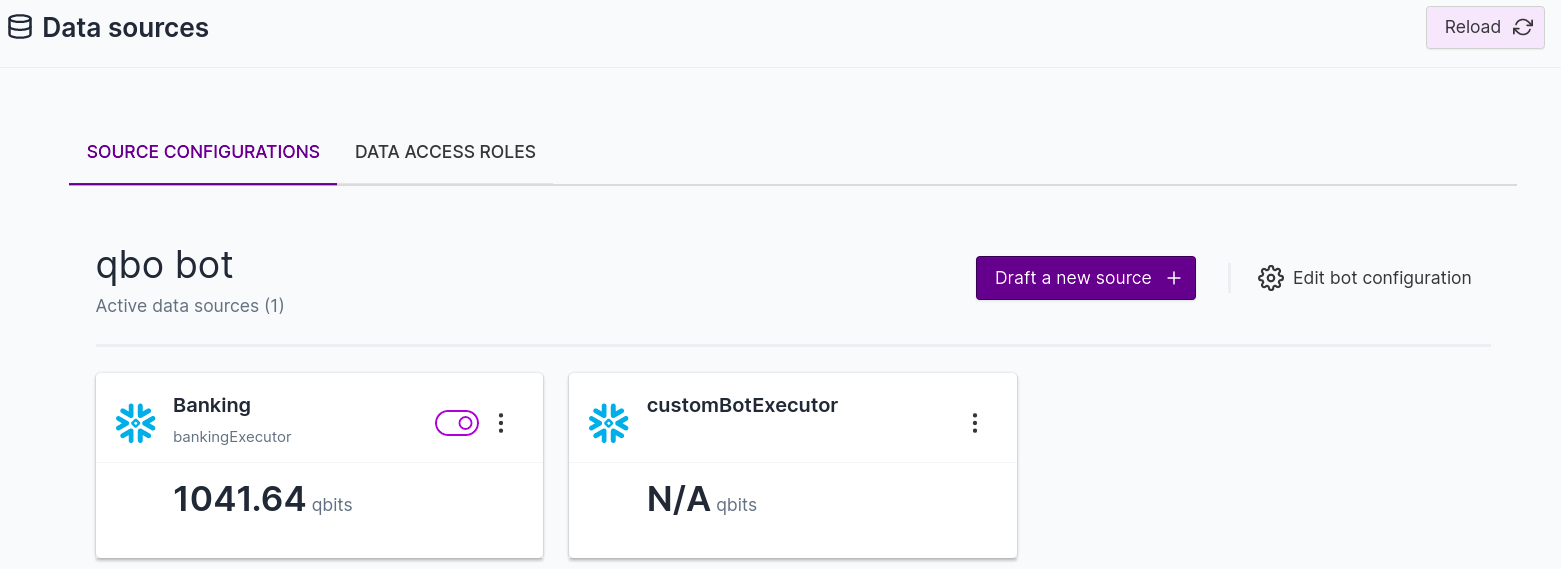
Click the Edit button to start editing configuration.
After making all the necessary edits, click the Save draft button to save your changes.

You will see a
Draft added successfullymessage if all the changes save successfully.If you want to go back to the data sources, click the Back button.
Now you will see an added icon of the draft you were working on in the data sources. Click the Edit icon to make further changes.
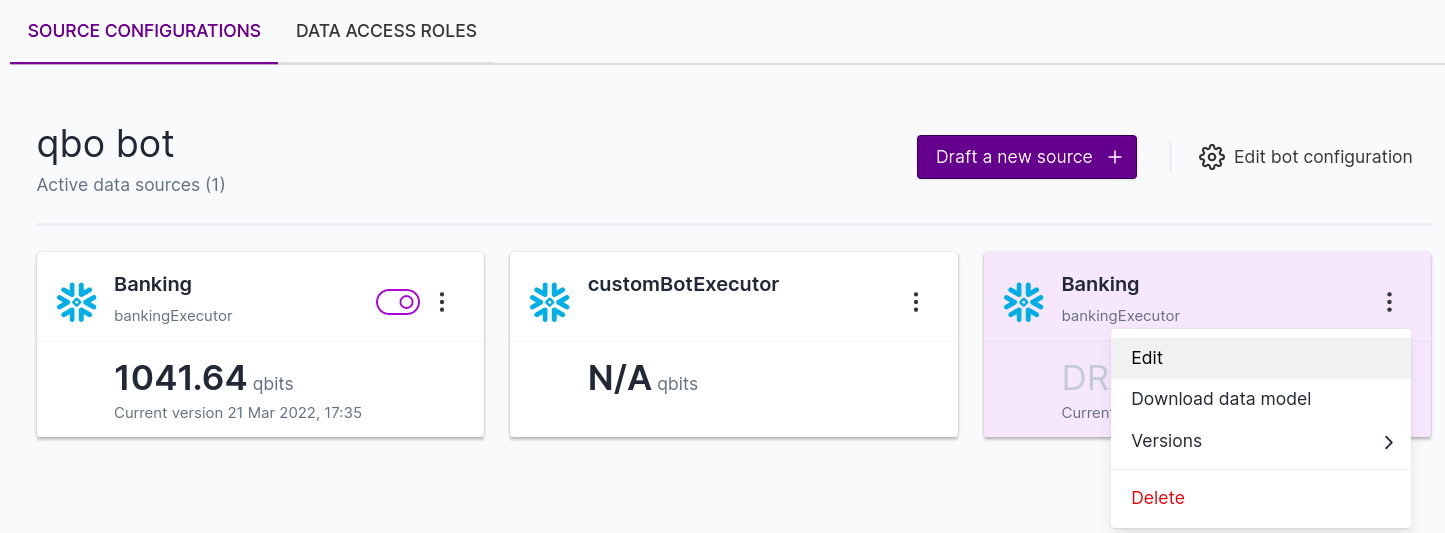
Click the Save draft button, then the Activate draft button.
You will see a
Draft activated successfullymessage if the draft activated successfully.Reload your data sources.
You will see a
Query bot server reloaded successfullymessage if the draft reloaded successfully.Use Discard changes and Discard draft to remove your changes.
Data access roles
You can define roles to restrict access to data sources or restrict entity or attribute access for a set of users.
A role allows a user to use functionality in Qbo to perform a task or set of tasks.
For example, you might need to hide some critical information from a developer role or reveal a particular set
of data to the analyst role. Data Access Roles allow you to do this. You can restrict the
access of a user to certain entities or specific attributes of the entities. You can also go further to limit access
based on the value of the attributes.
To configure data access roles, click the DATA ACCESS ROLES tab and click the Data Sources link.
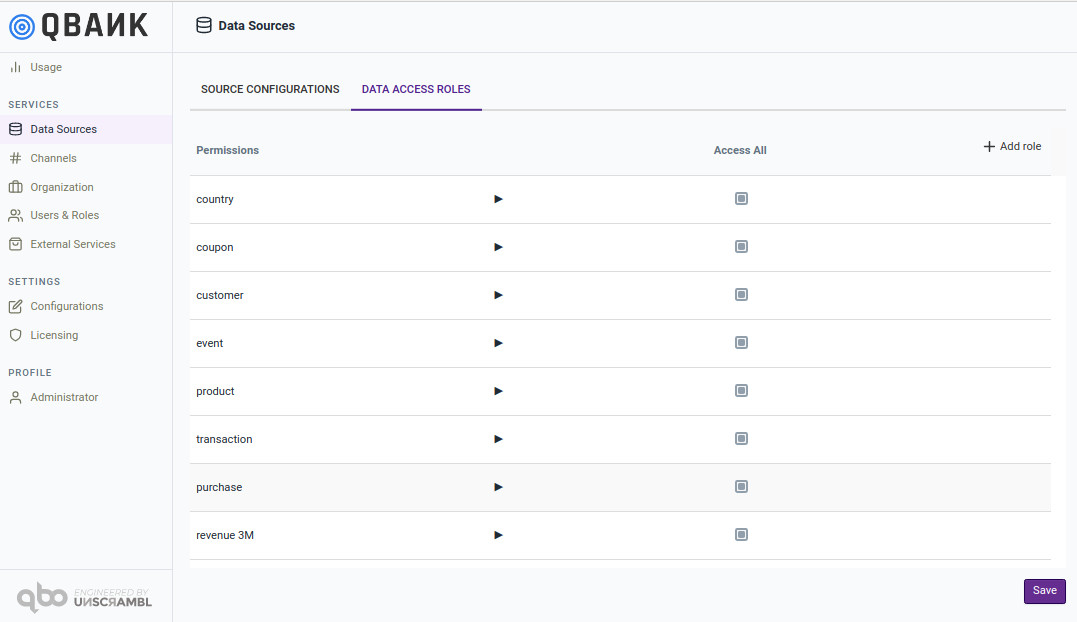
For example, create an Developer role.
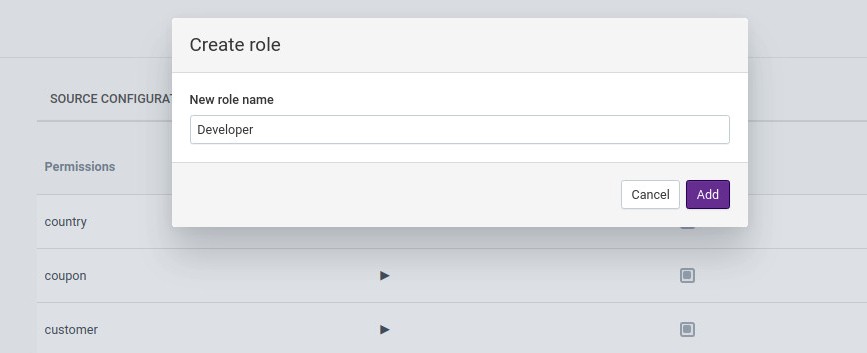
Give this role access to customer and product entities only.
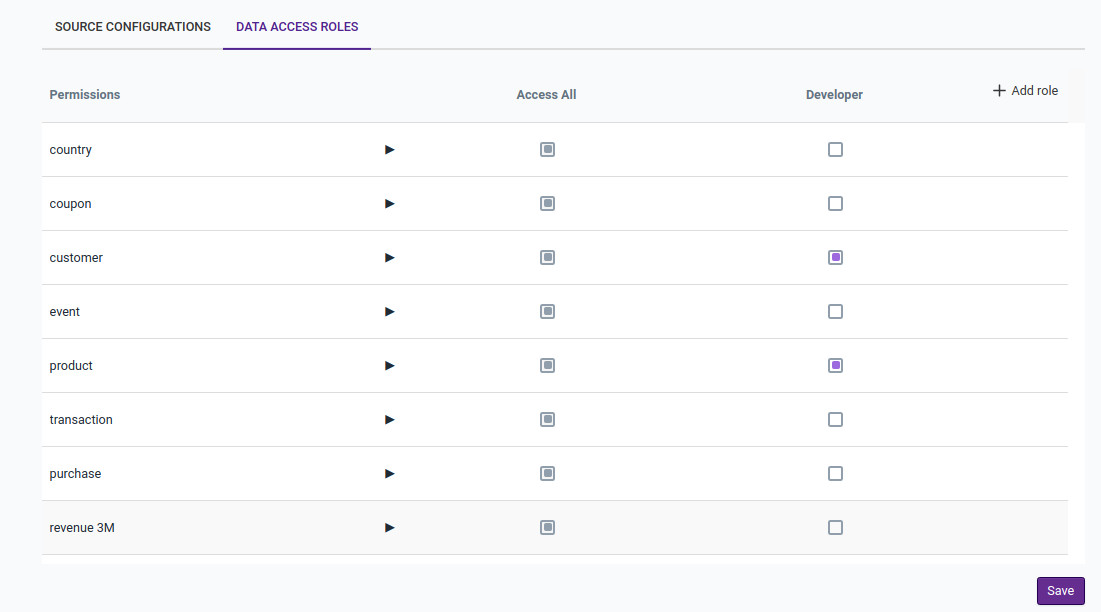
Further restrict the Developer role and make the gender attribute not accessible.
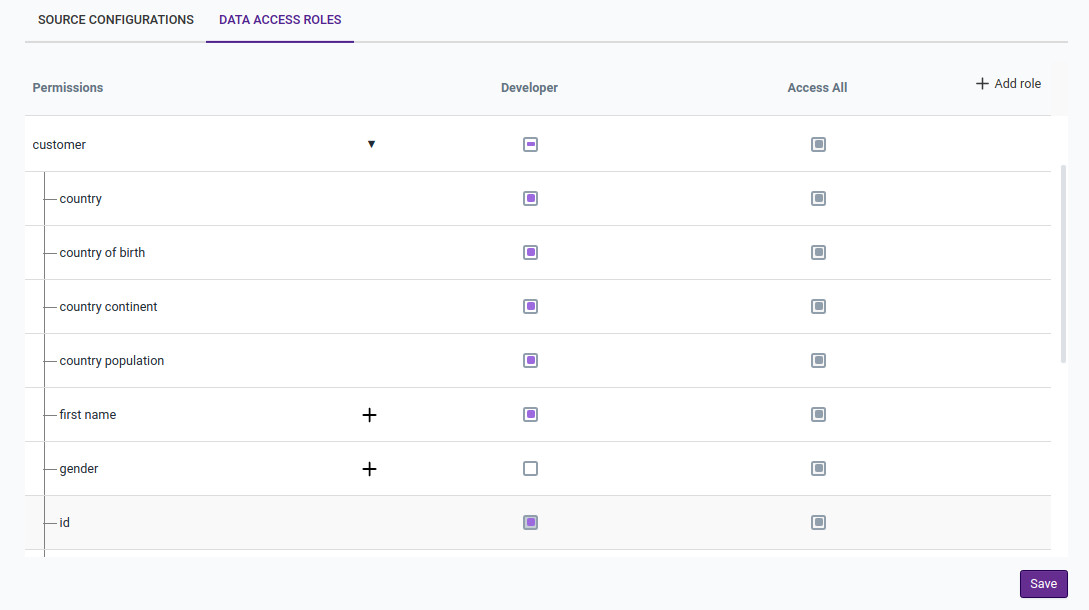
Restrict the Developer role to accessing product entities with code equal to US-HEALTH-01.08.
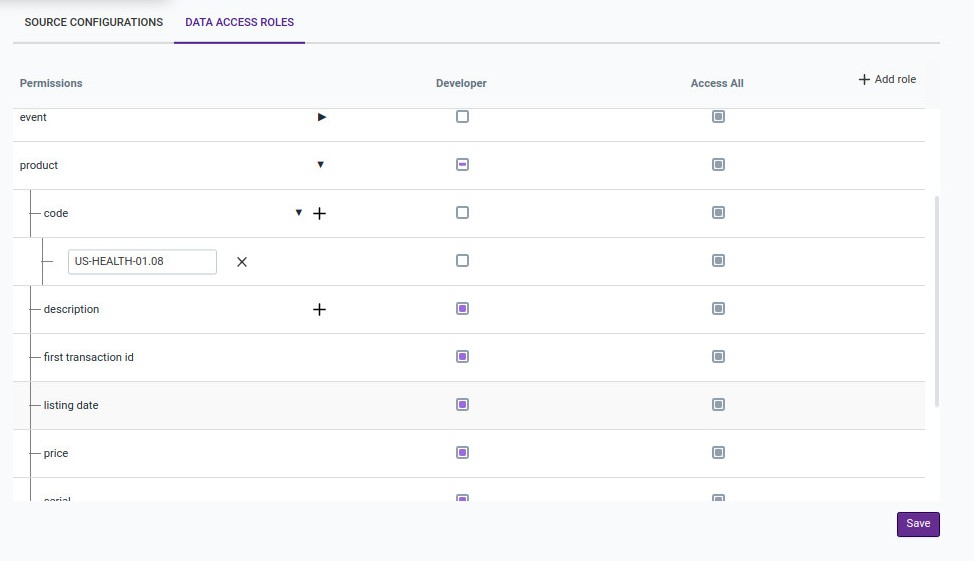
Hovering over the role name will give you an icon to delete the role.
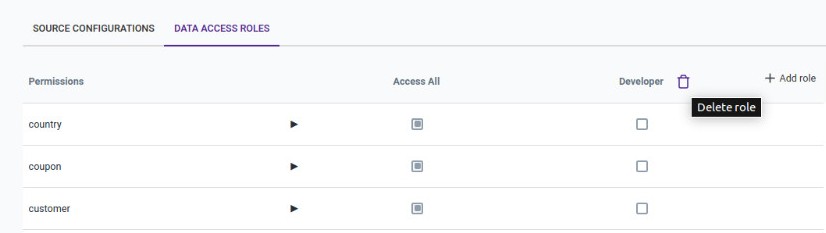
Update John’s data access role from Access All to Developer.
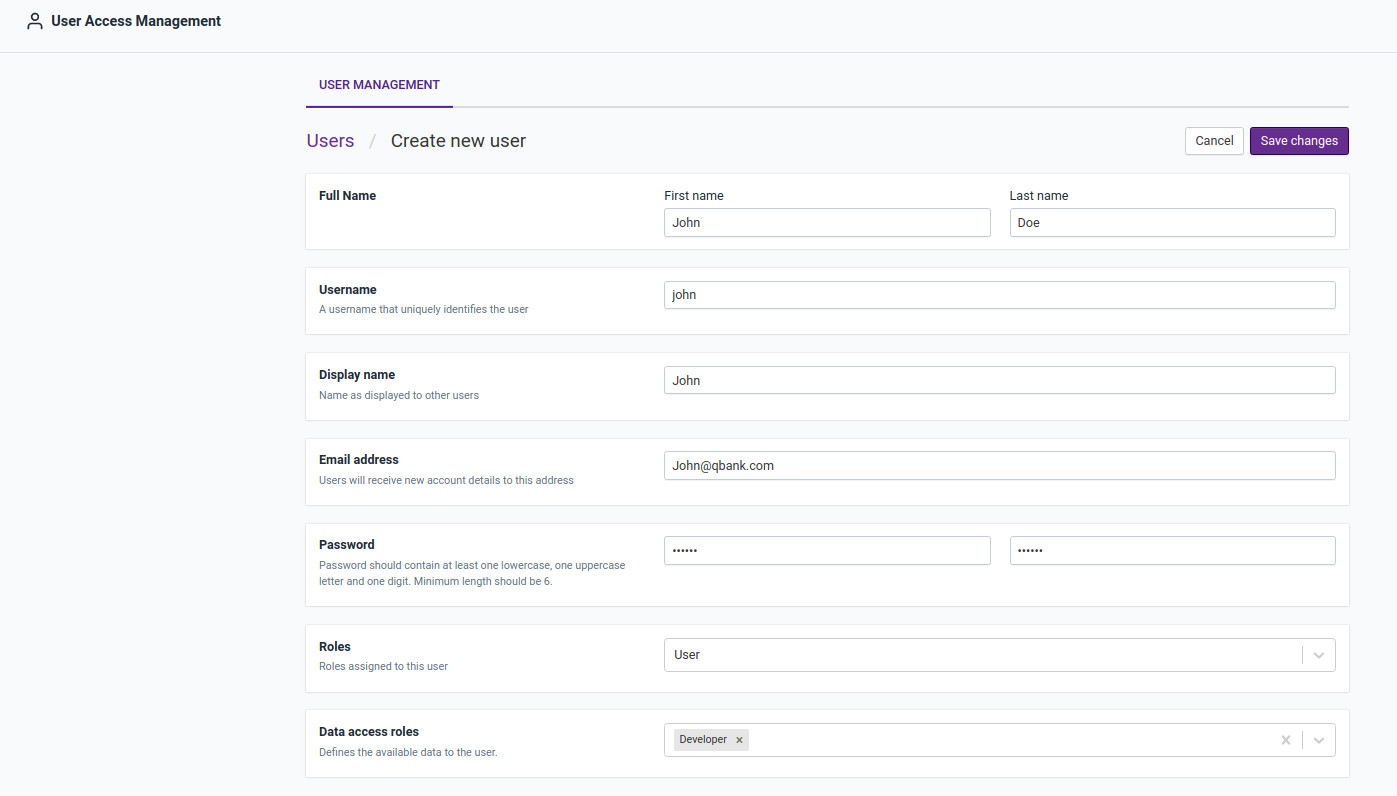
Click the Save Changes button to see the updated role of the user.

Now sign in as user John and test queries for entities.
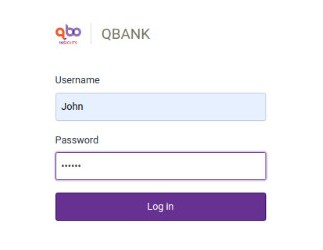
John is not authorized to ask questions on the event entity.