Boards
- Each conversation thread has its own board. You can save important query outputs - like charts and texts - by adding
them to the thread’s board.
View to expand vizies
To add an insight to a board:
From a thread, click on the
 button below the query insight.
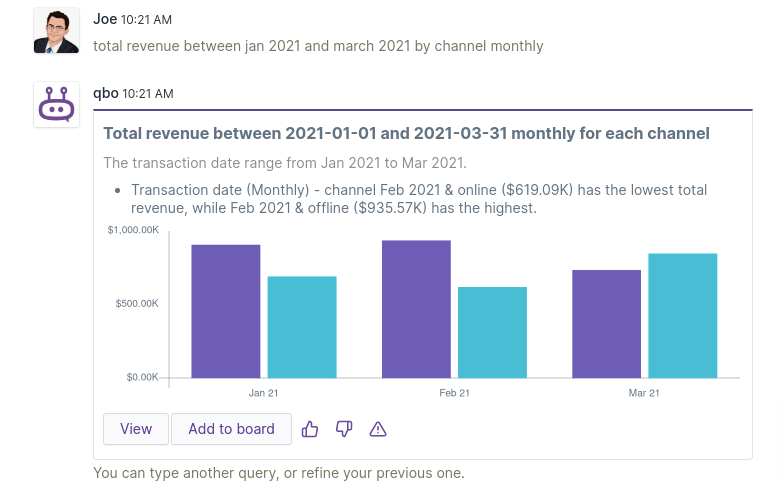
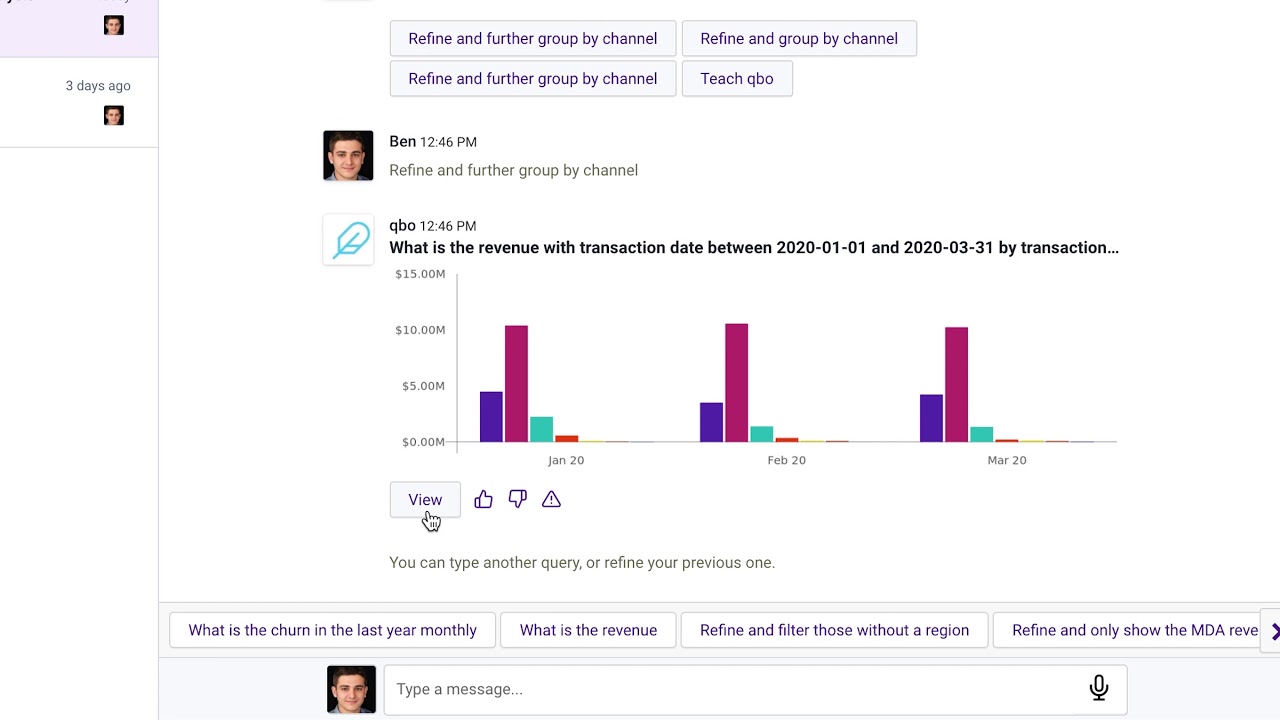
- Provide feedback to Qbo about the result. You can like or dislike the query result, or report an issue with it by
clicking on
 icons respectively.
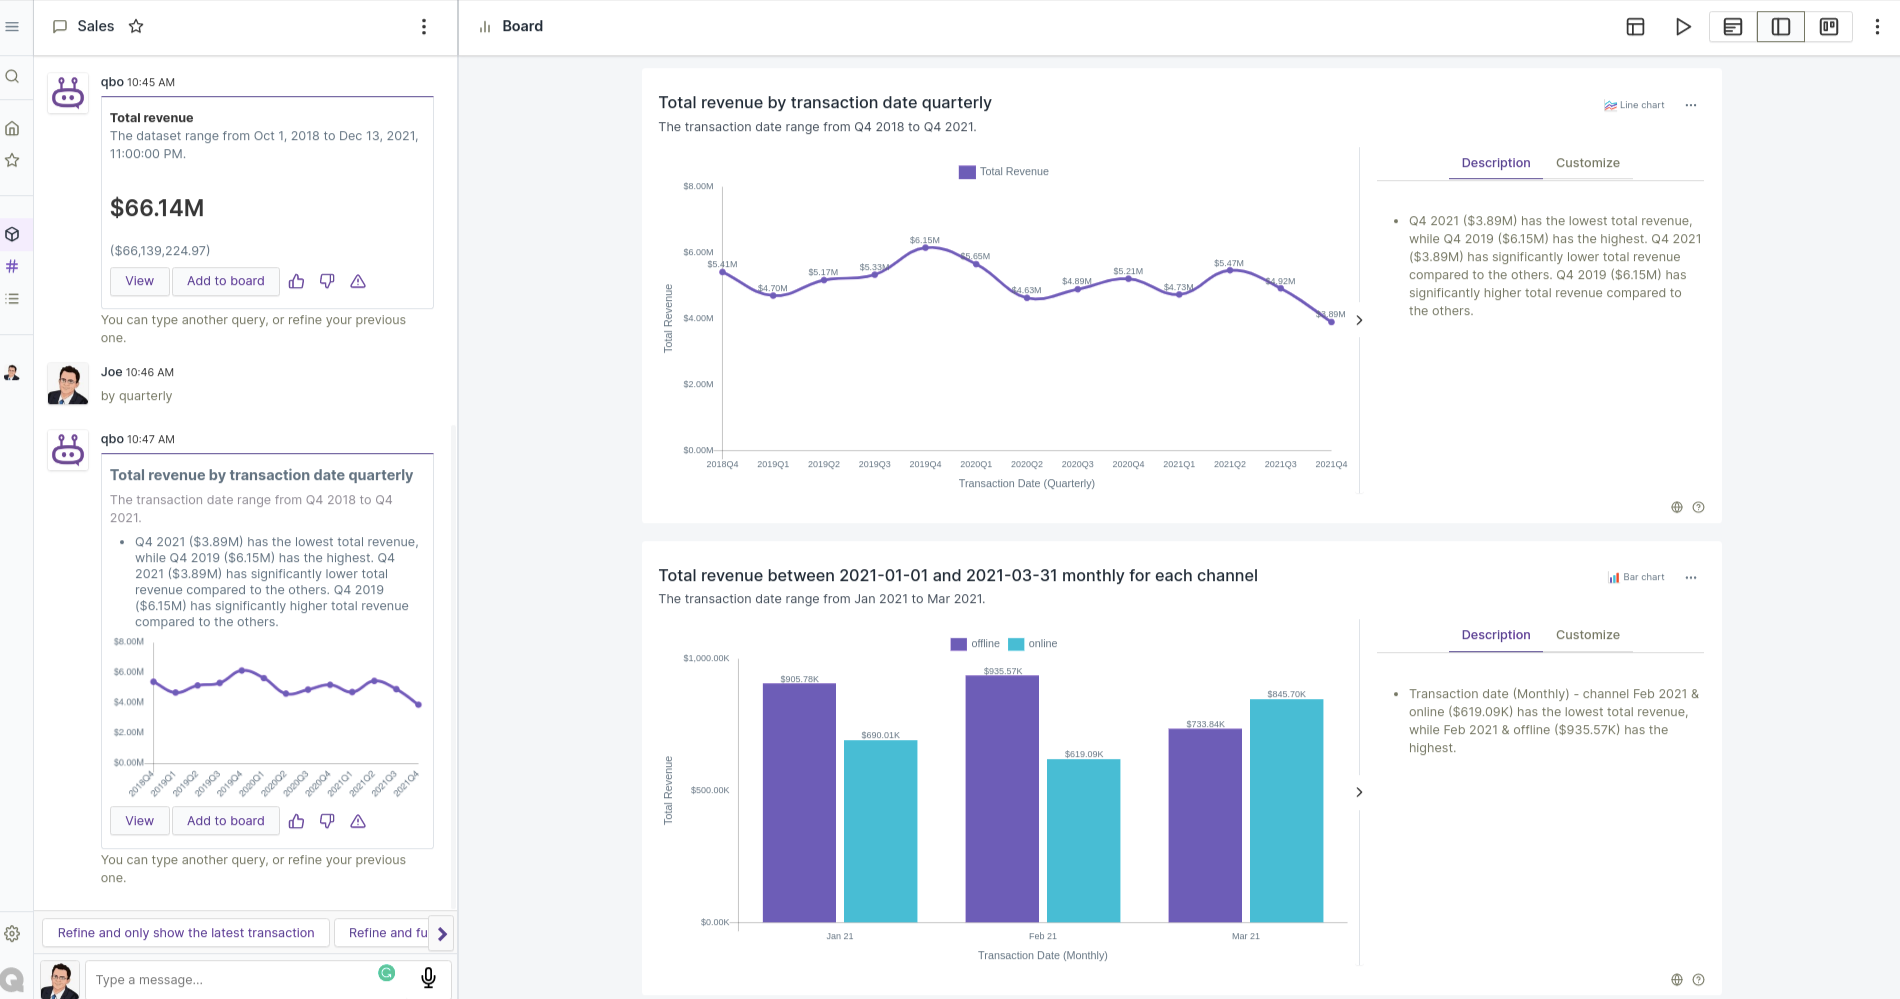
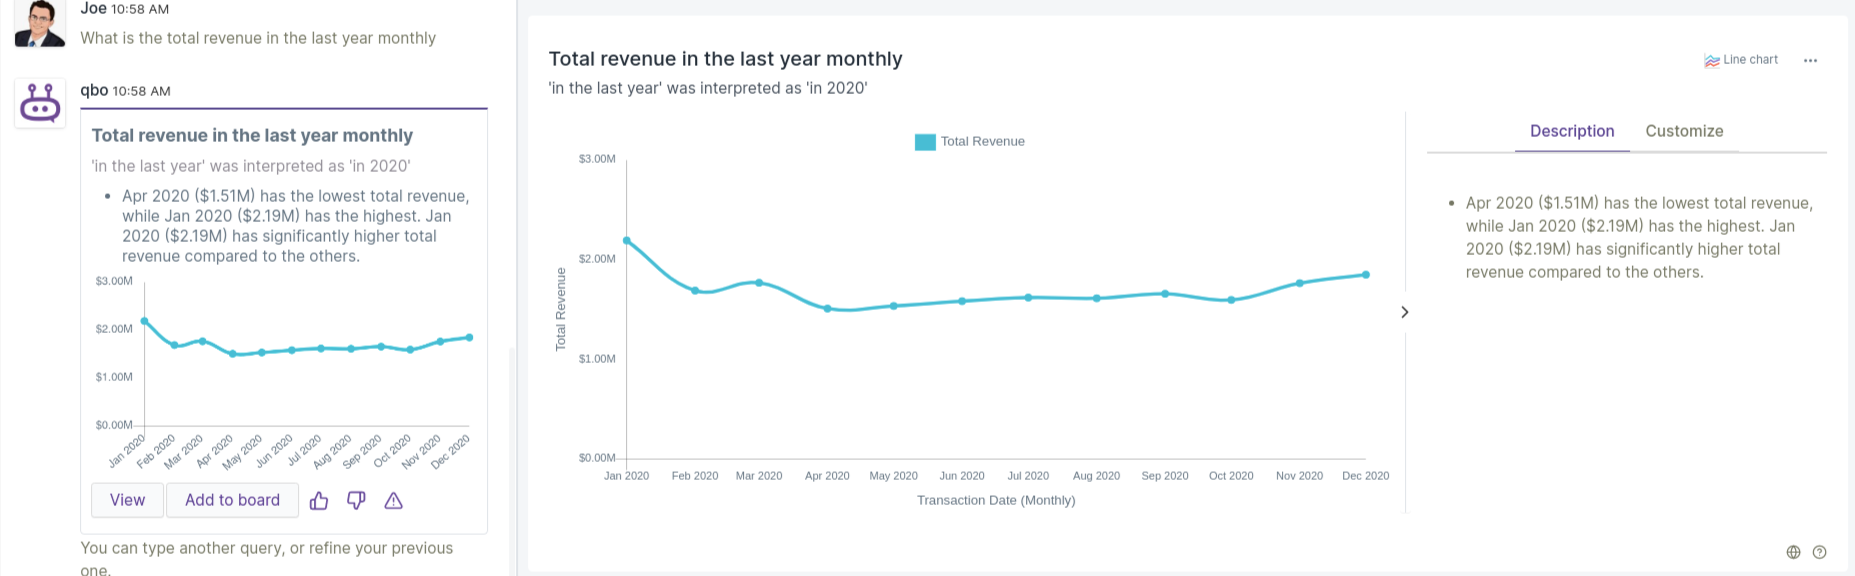
The query insight opens in a separate window showing the query insight in detail.
Hold the pointer over a graph to view detailed values.
In the top right corner of the query insight window, click
 > Add to Board.
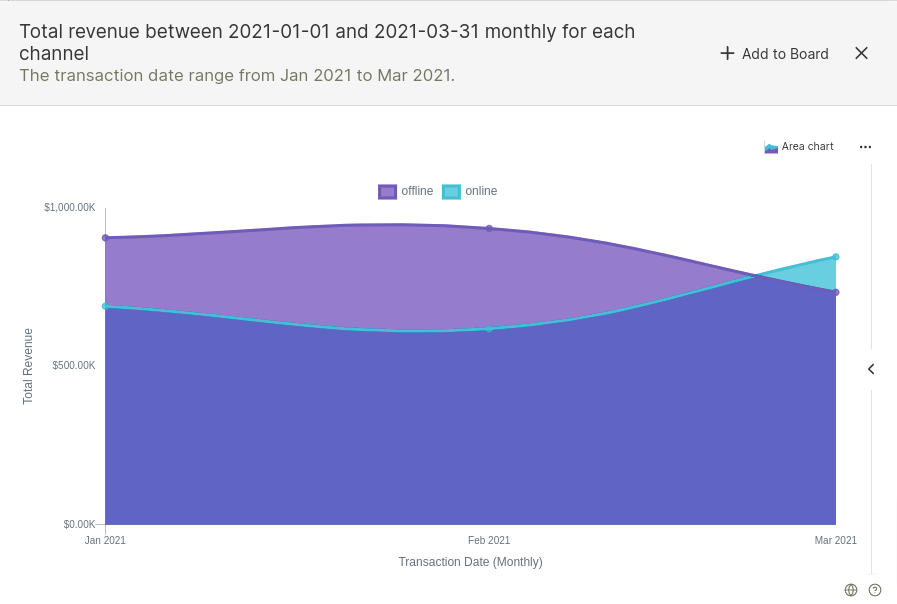
We have  button available with vizy response, it allows us to quickly add a vizy
(or a vizy group) to the board from the conversation without View it.
button available with vizy response, it allows us to quickly add a vizy
(or a vizy group) to the board from the conversation without View it.
See more available vizy options in the Explore Vizy Options section.
Explore board options
Once the vizy is added to the board, users in the conversation can play with the data it displays.
- You can pin insights to a board as well as charts. These insights, displayed on a board, are called vizies.
You can change a vizy’s layout, use it in presentation mode, remove it from the board, or download it as a pdf.
Related Videos
Pin and play with Qbo boards
Board Options
The main options available for each board are  :
:
 Change layout: Sort the order of the vizies.
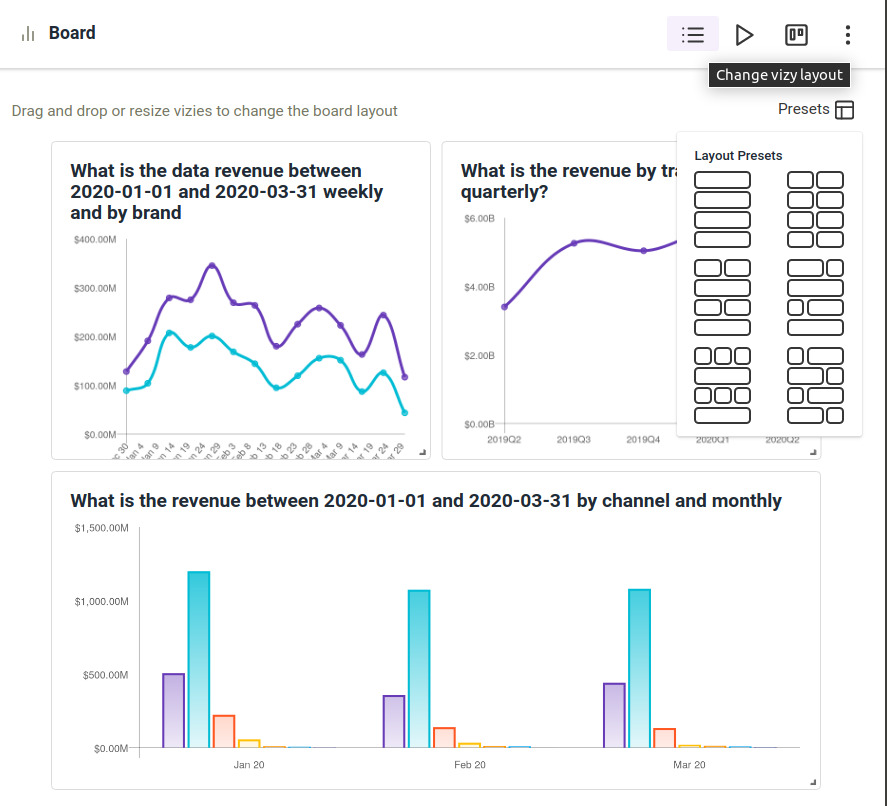
 Copy Vizies: Copy vizies from other boards.
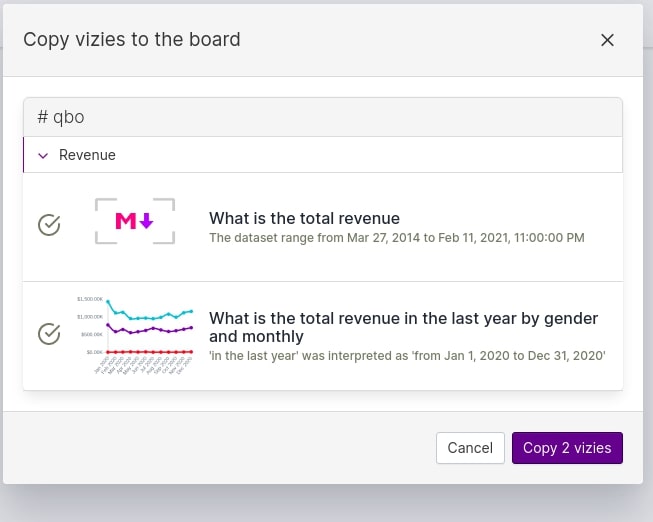
 Presentation Mode: Go into presentation mode.
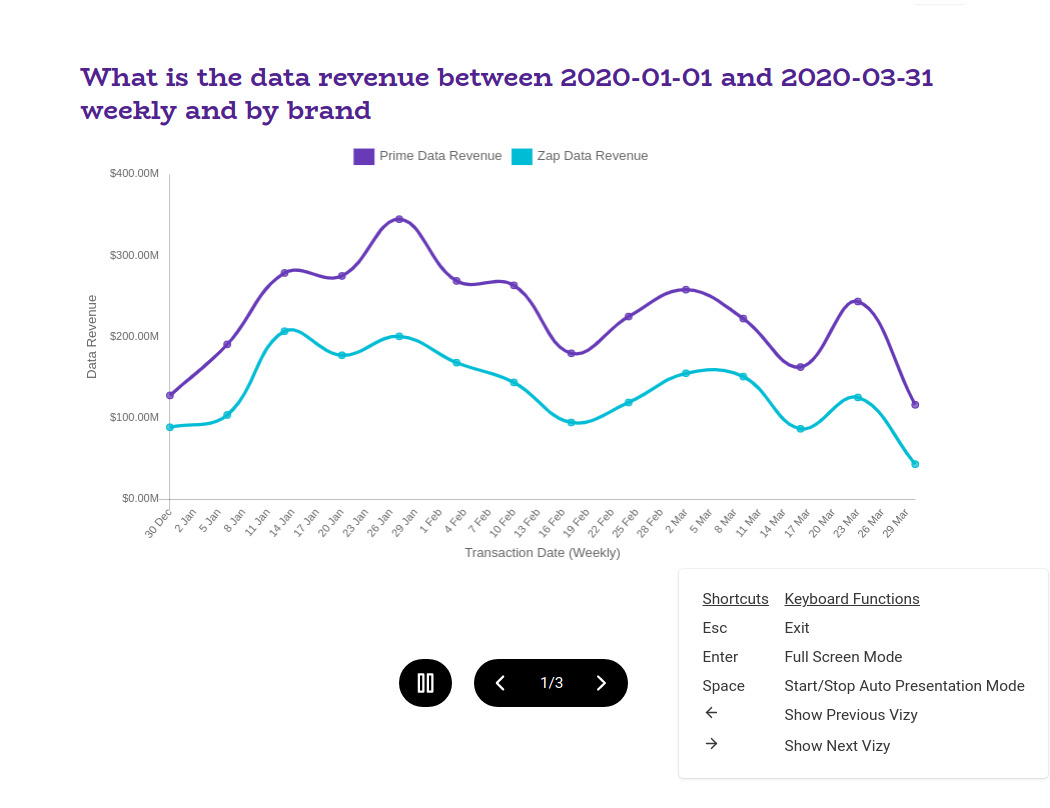
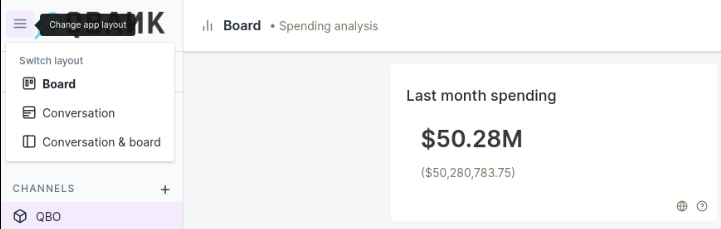
 Switch Conversation & Board: Switch between Board, Conversation and
Conversation & Board layout.
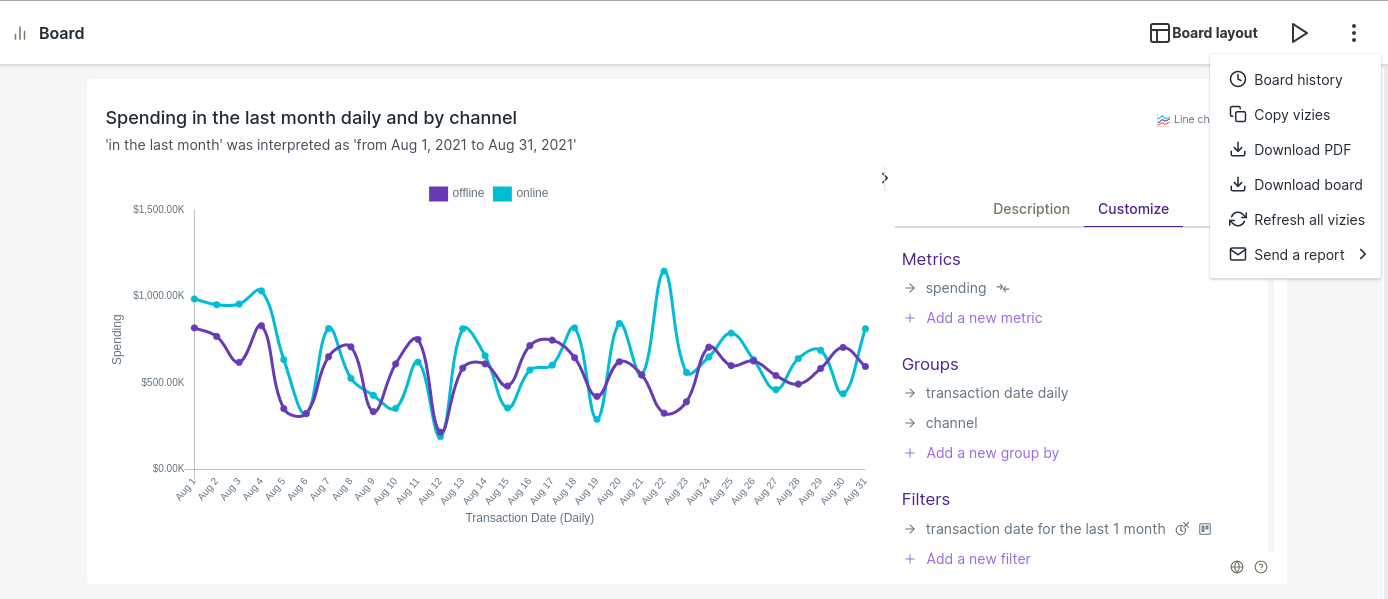
 Click More: Refresh all vizies ,to see board history, copy vizies to the board, or download the
board as PDF.
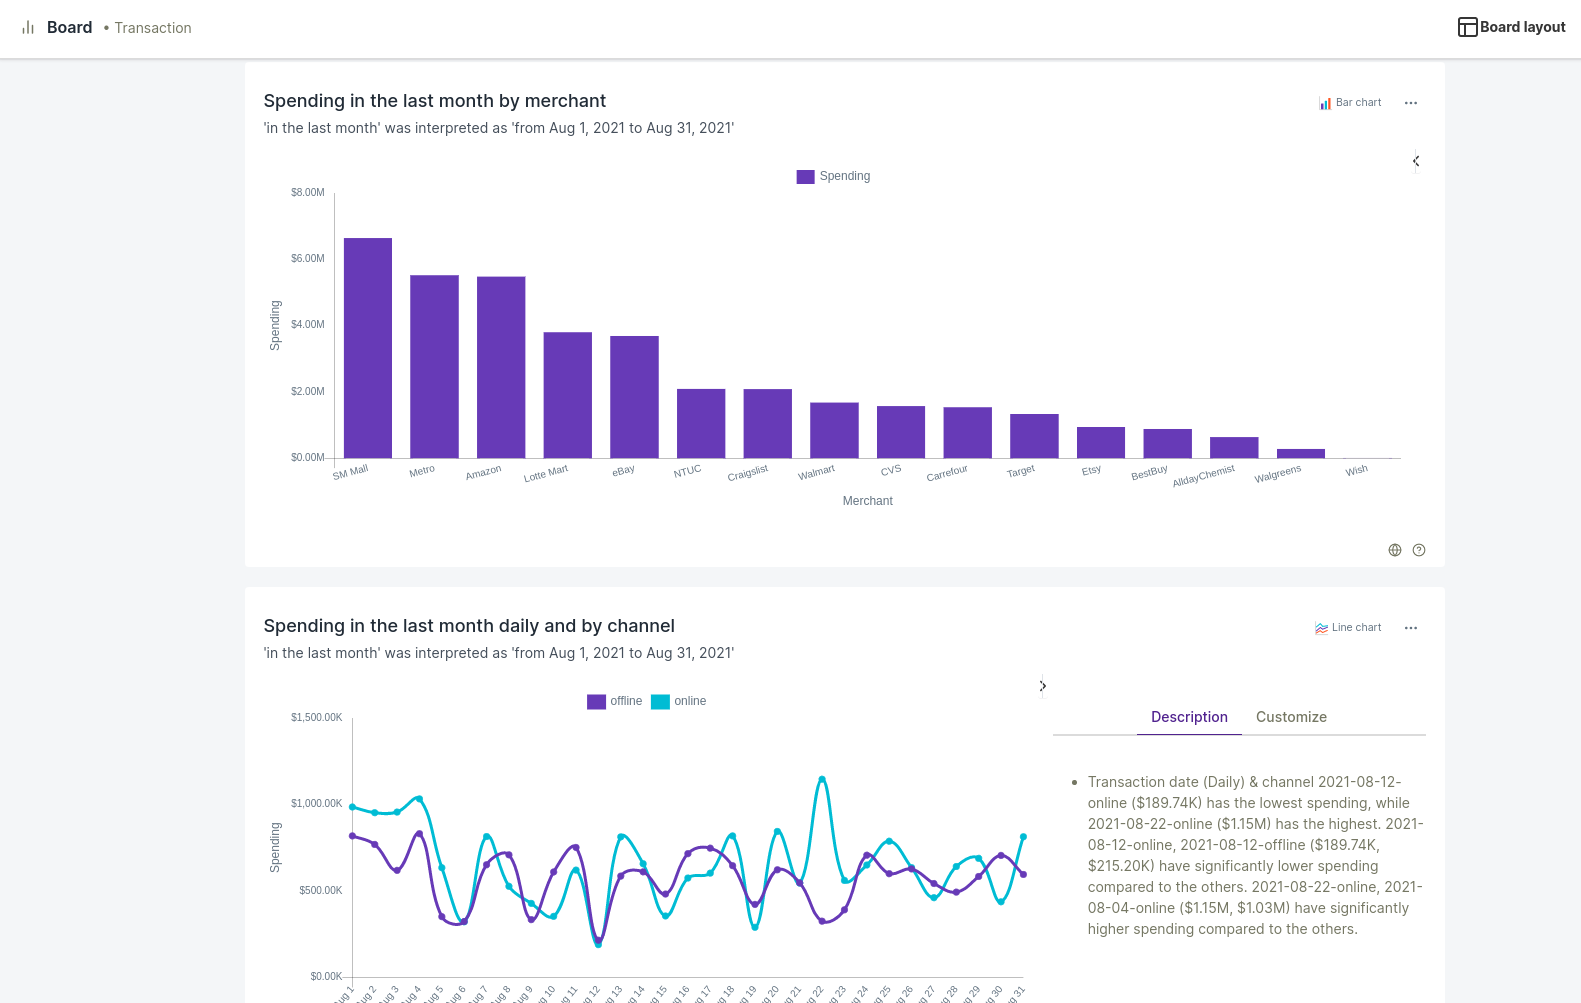
Board history
You can use board history to track changes to a board. It stores the latest 10 operations performed on the board, including:
creation
layout updates
vizy additions
vizy modifications
vizy removal
vizy customizations
filter additions
All operations are stored with a timestamp.
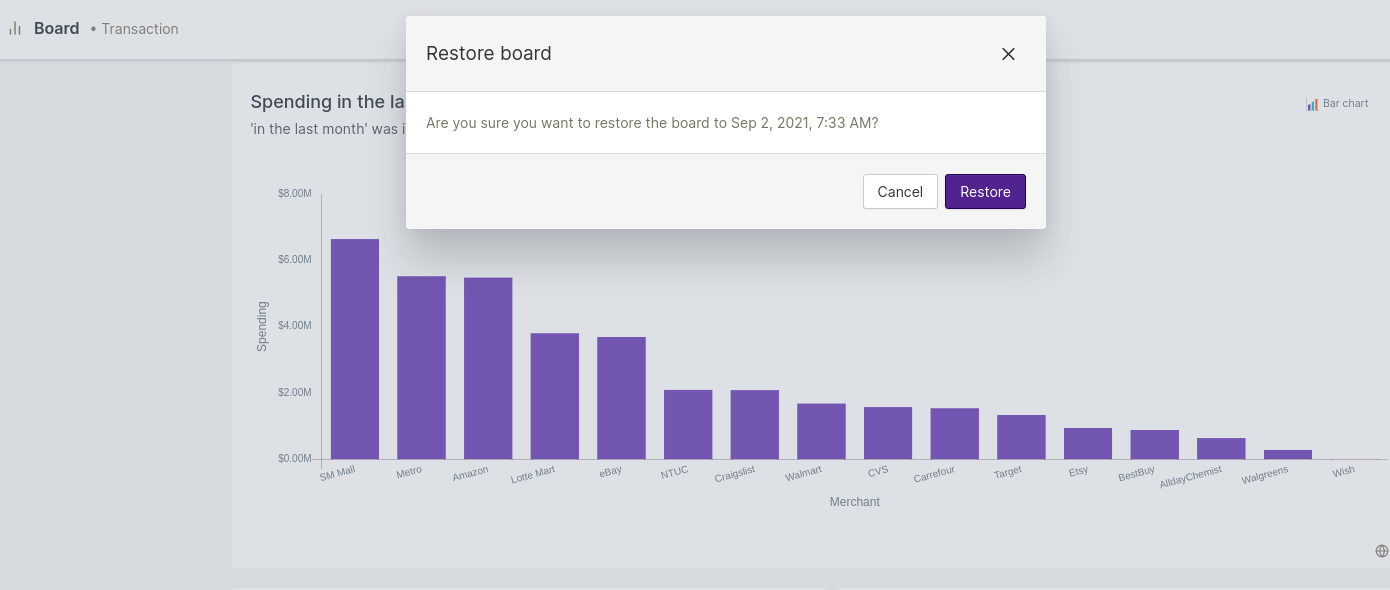
If you want to restore an older version of a board, select the required version or timestamp from the board history.
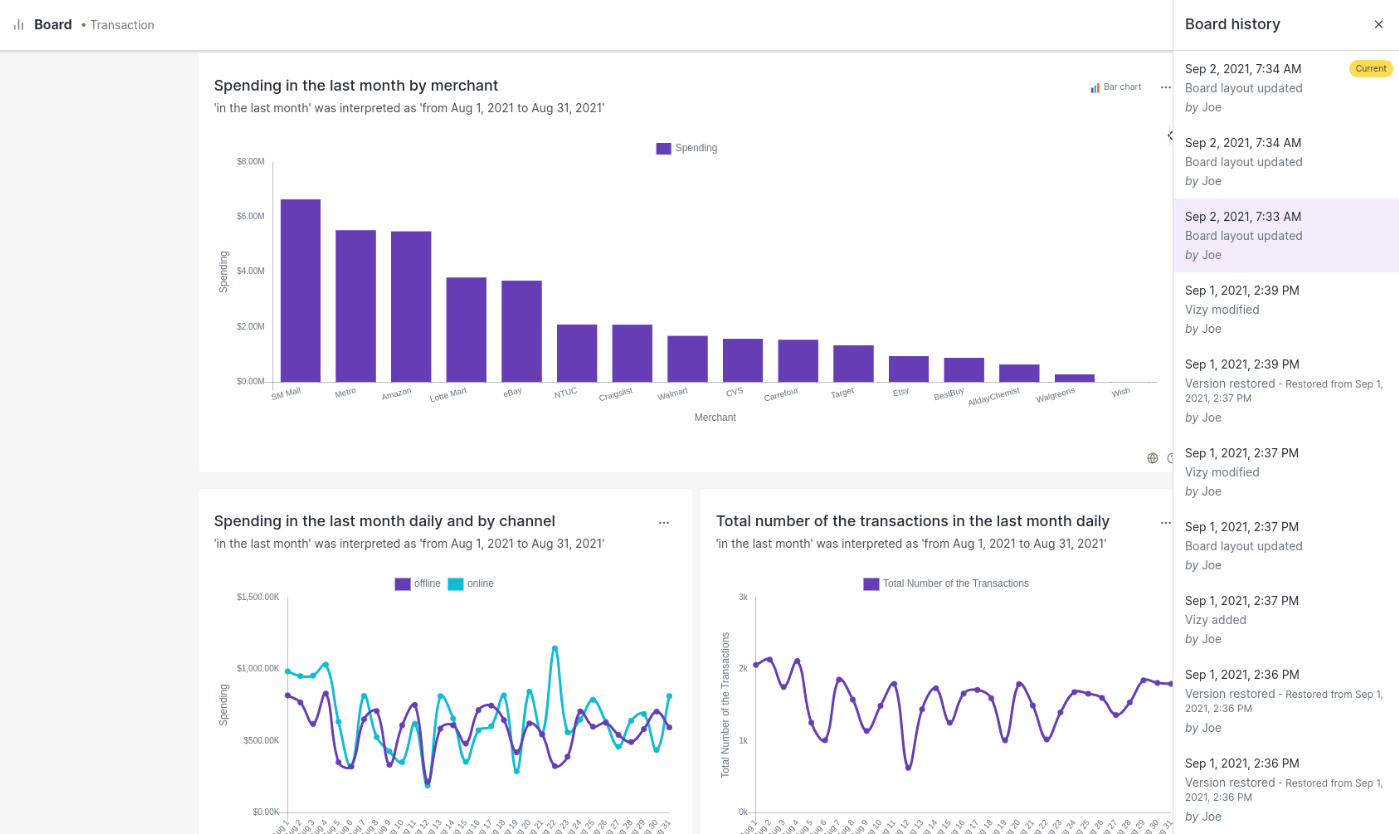
In this example we are reverting a board to a state which was in its old state at 7:33 am:
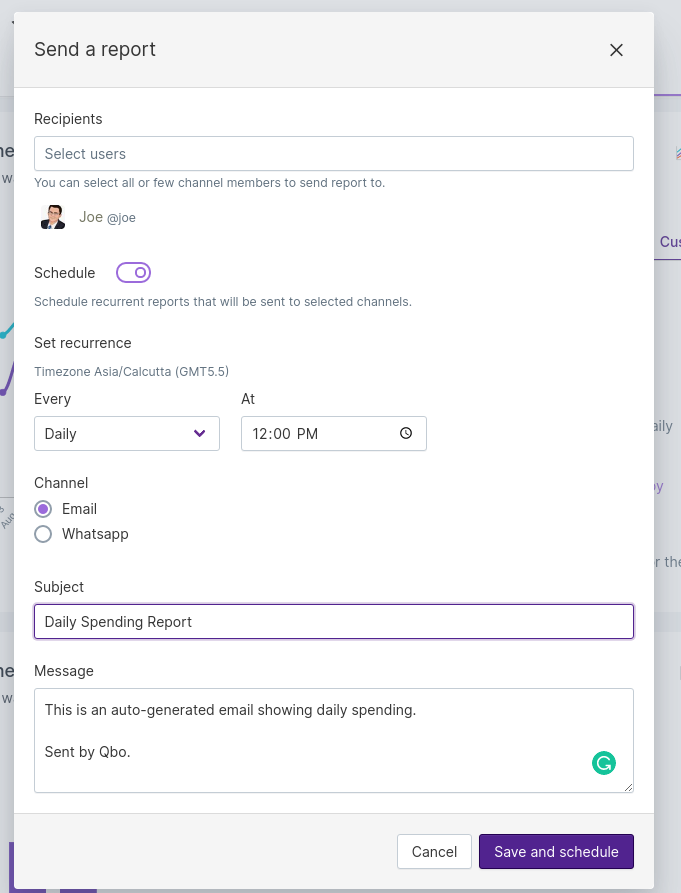
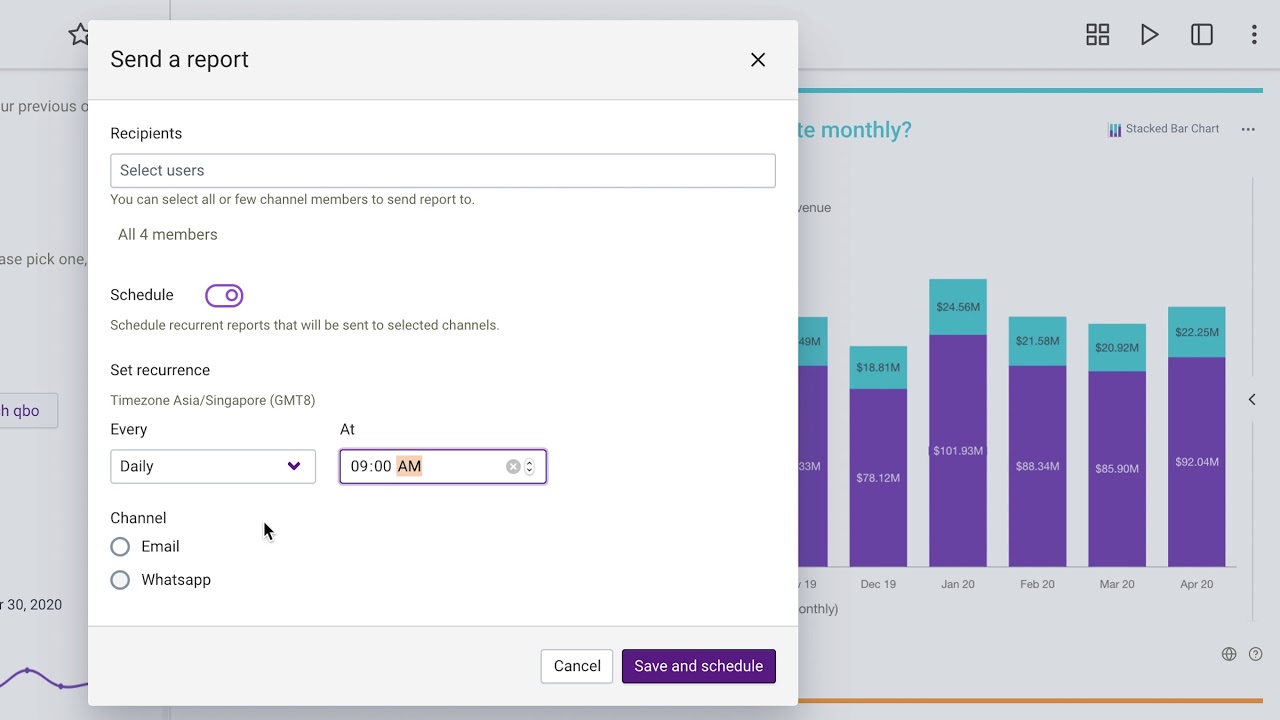
Send a report
If your administrator has enabled Communication Services, you can send and schedule reports. You can create new reports, schedule periodic reports, and delete existing reports.
Related Videos
Schedule a report in Qbo
You can frame a report body, add a subject line, and select users who’ll receive the report.
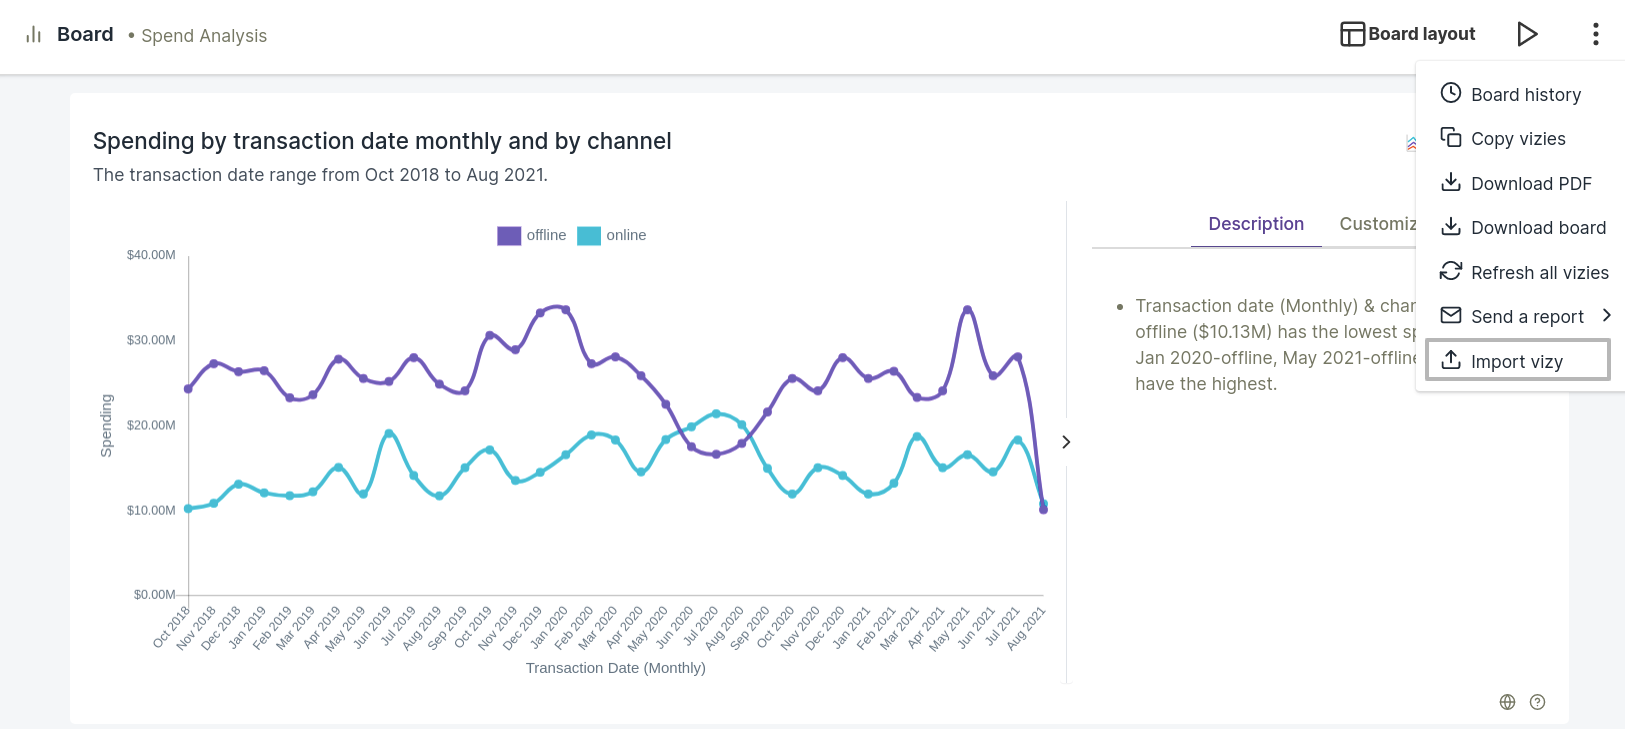
 Import vizy: Import any vizy file - files with a
 .vizy extension - to the board.
Note
To download a vizy file:
Go to the board and click on the horizontal ellipsis (3 dots) for the vizy you want to download.
Click Download > Vizy.
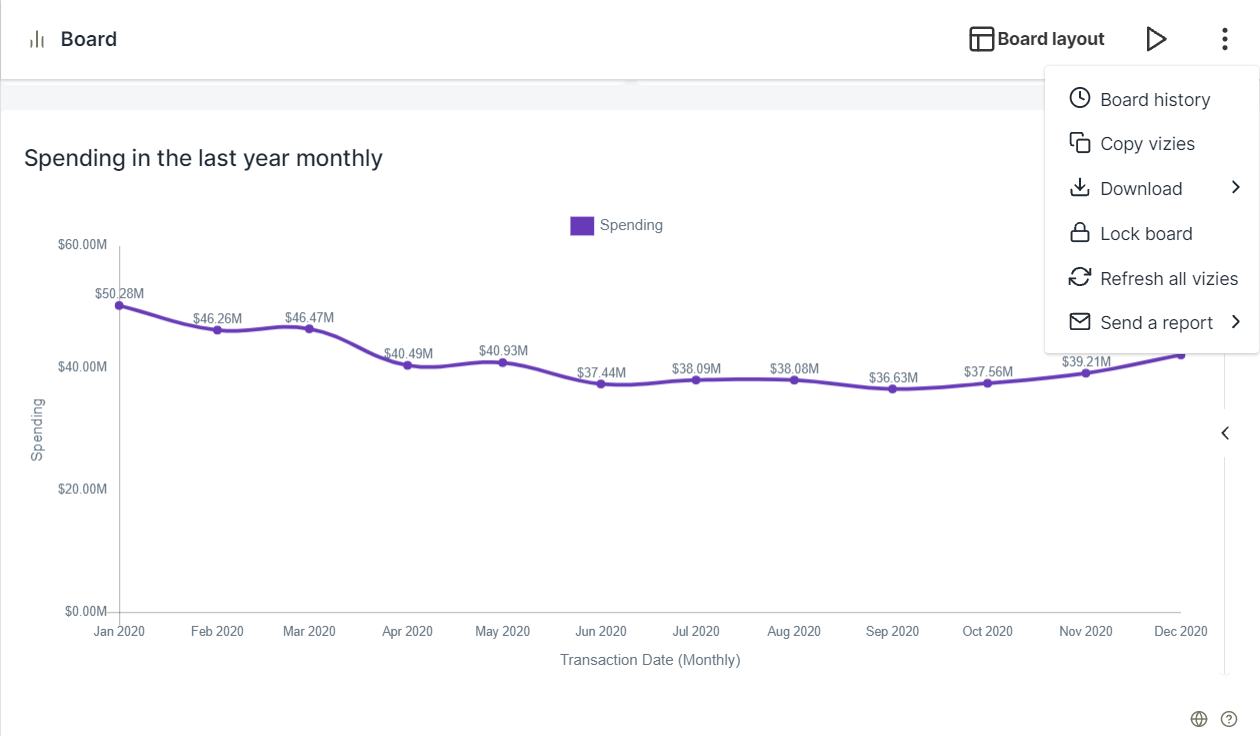
Lock-Unlock board feature
Limit the the functionality of all users in the channel of a board. To lock a board, click the horizontal ellipsis (3 dots) on the right of the board and click Lock board.
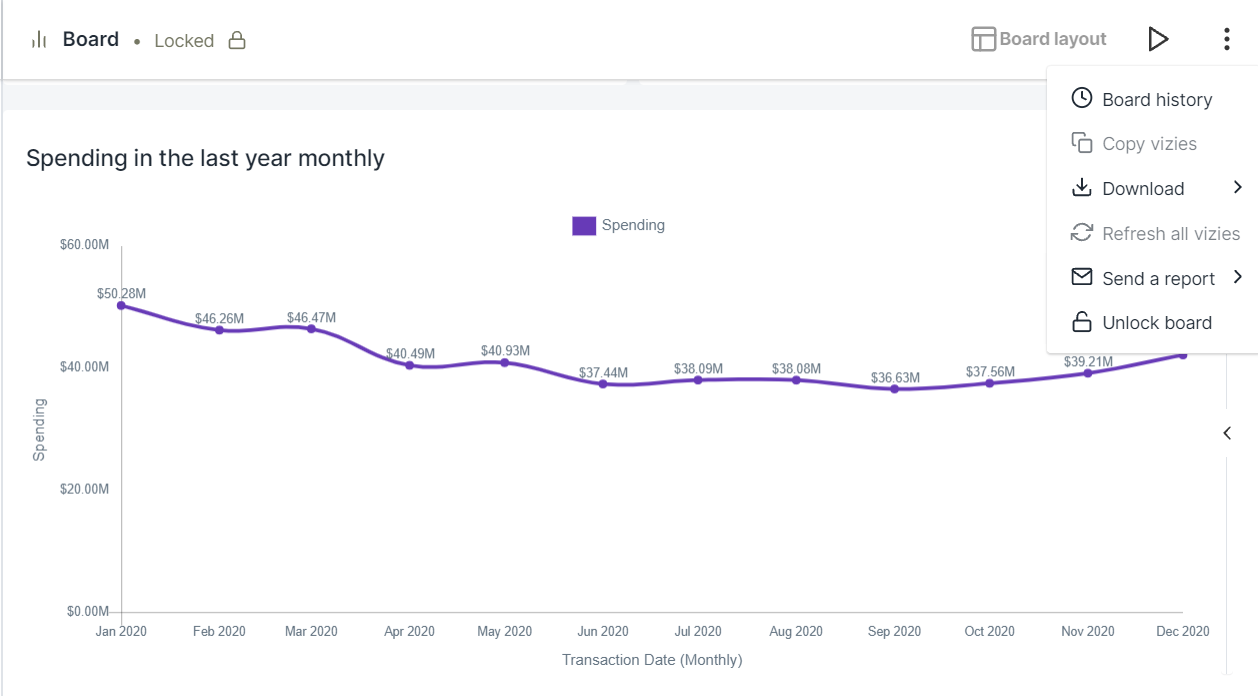
Once the board is locked, users in the channel will not be able to:
Add/Import new vizy to board
Change board layout
Change vizy types
Add/Edit filters
Add/Edit groups
Add/Edit board filters
Refresh vizy datas
Select a board state from board history
Show/Hide total
To unlock a board, click the horizontal ellipsis (3 dots) on the right of the board and click Unlock board.
Enable/Disable Board Filter
Once Board filters are applied, all the visualizations which have the Board filter will automatically change once the filter is changed. If the users explicitly want to remove the Board filters all at once they can do that using the disable button along with the Board filter. This button can be used as a switch that enables and disables filters on the entire Board based on the needs of the users.
Once the board filter is enabled, the users will be able to:
Apply filters across all the visualizations
Custom select the visualizations on which they want to use the Board filter
See all the visualizations change on a click
To disable the Board filter, just click on the Board filter button to Unchecked state:
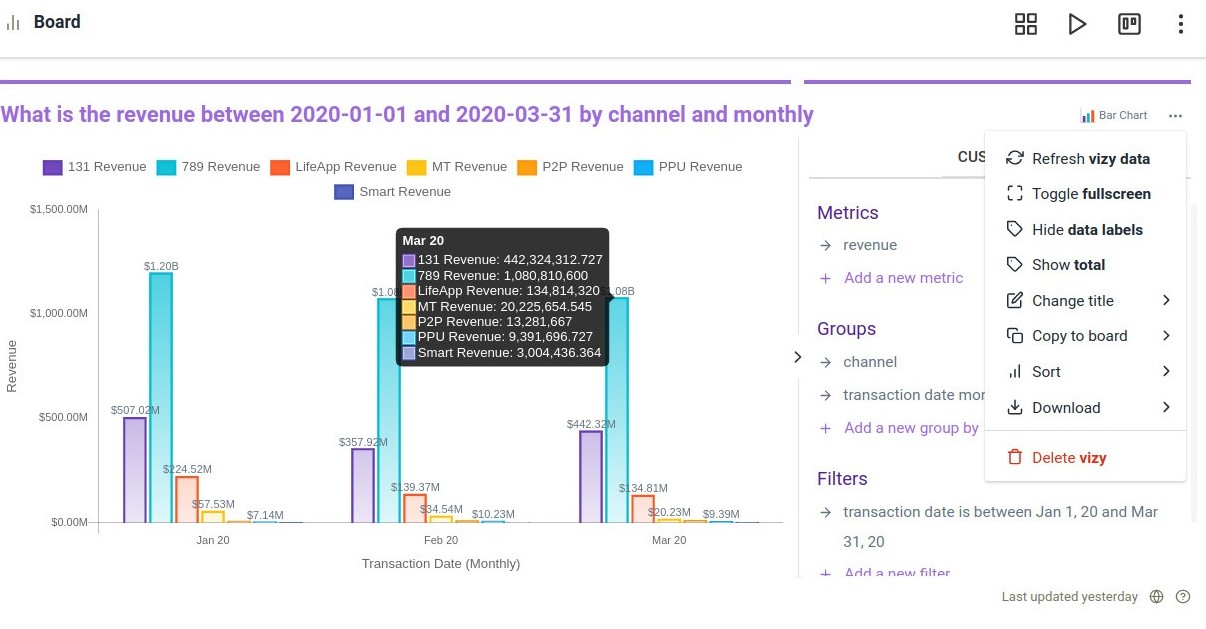
Explore vizy options
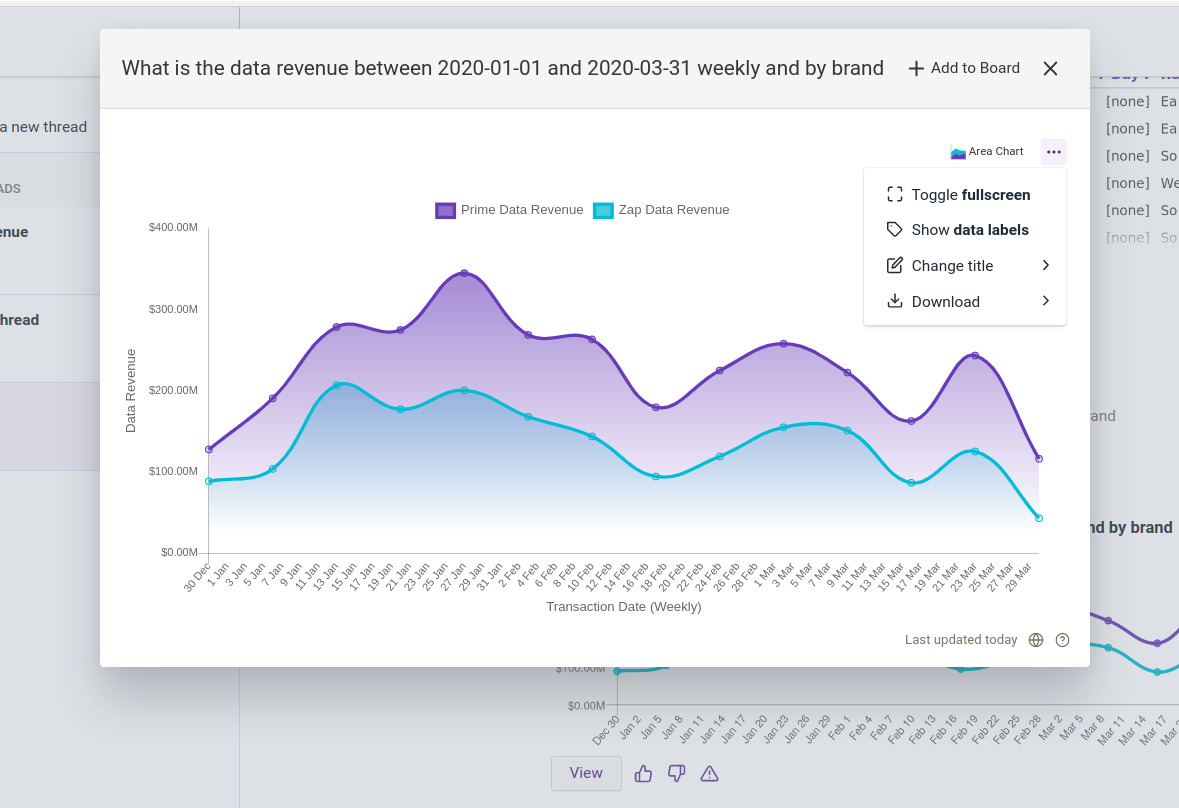
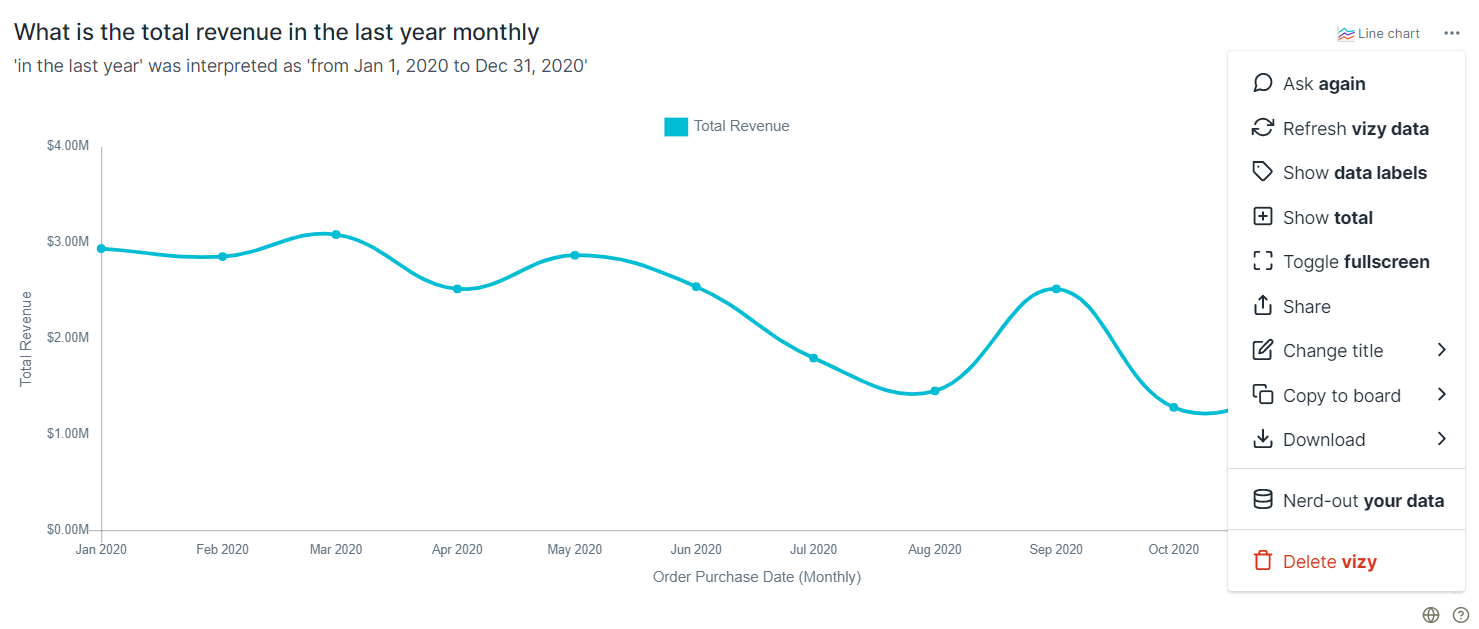
You can refresh a vizy, view the vizy in fullscreen, change the chart type, and much more:
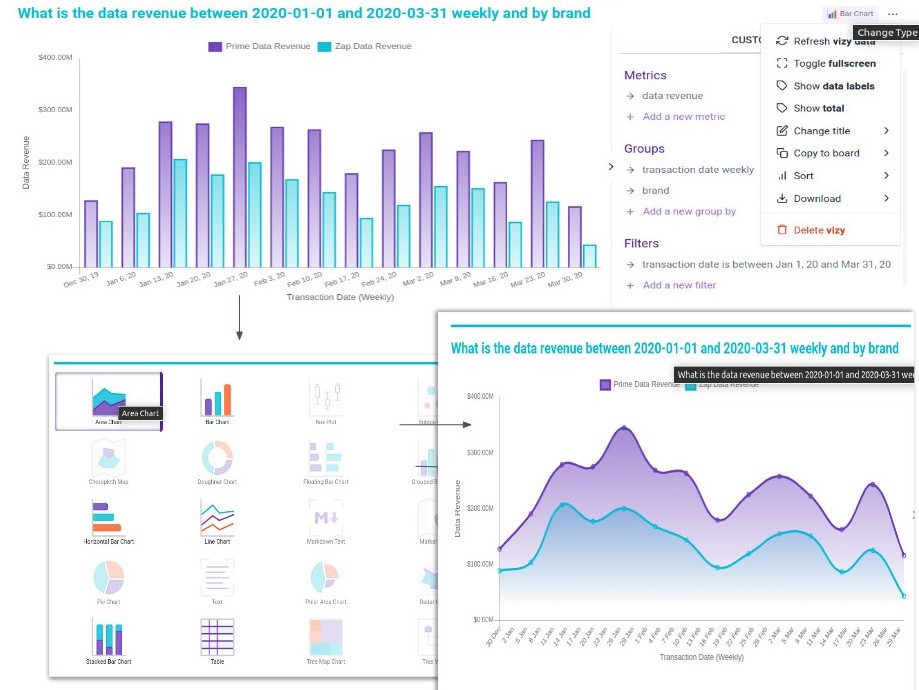
Change vizy type: Select the type of graph that you want for your visualization. Qbo intelligently selects the available graph types based on the number of variables in the output.
Related Videos
Qbo charts and customization
Refresh vizy data: Refresh a vizy.
Toggle fullscreen: Use this option to toggle between fullscreen and normal view.
Enable/Hide data labels: Display or hide data labels on data points for a vizy.
Show total: View totals in vizies to aid comparisons.
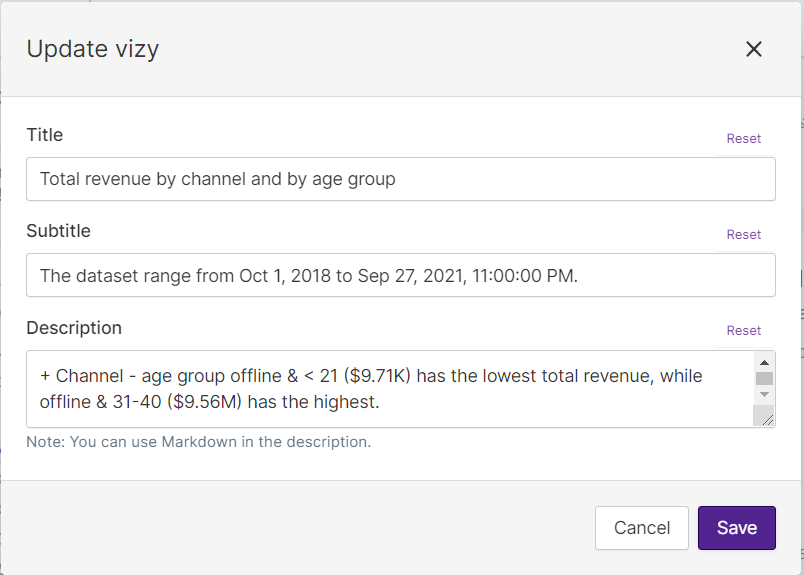
Update vizy: Update the title, subtitle and the description of a vizy.
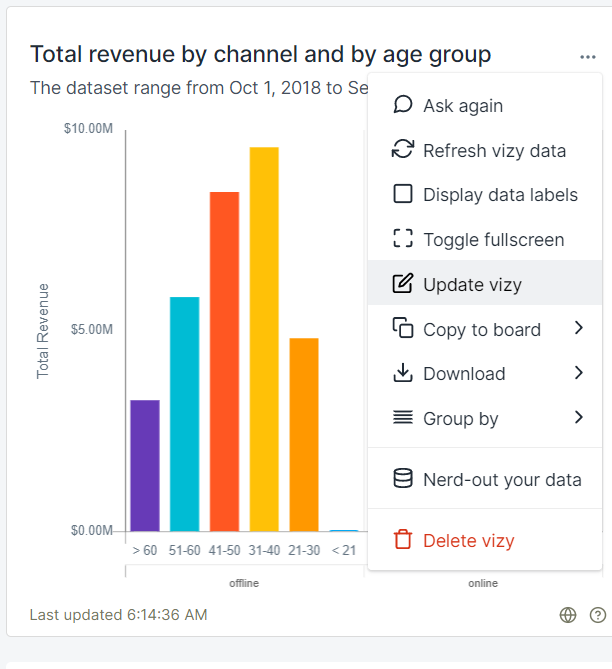
Copy to Board: Copy the vizy to other threads.
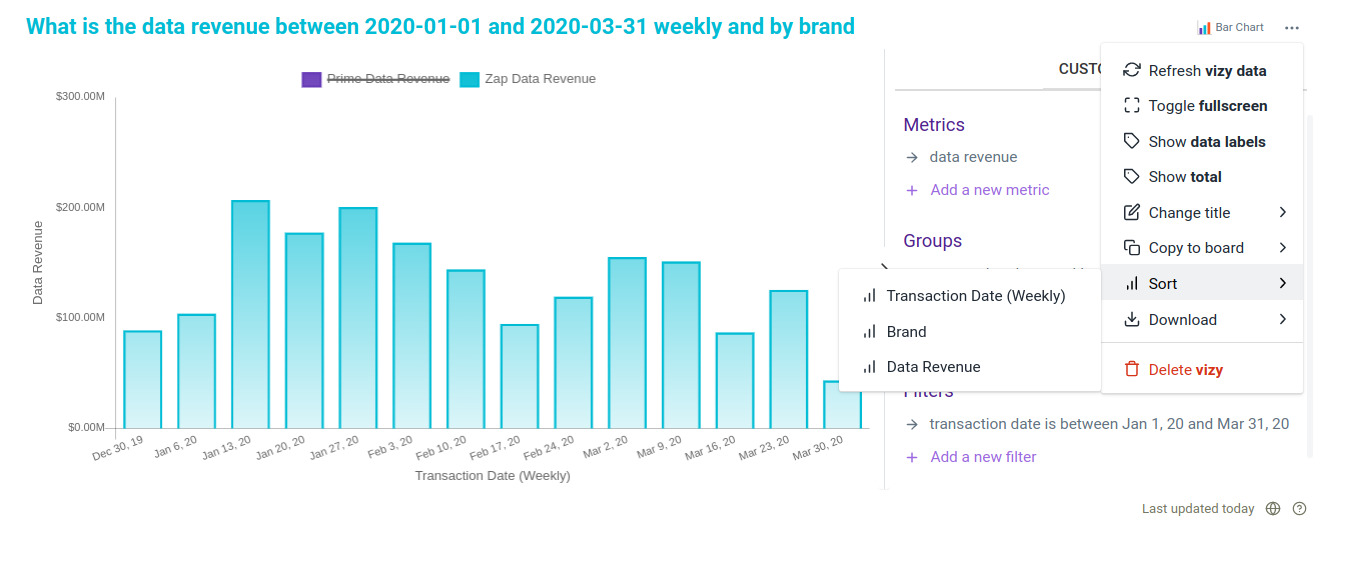
Sort: Sort vizy output by the legends available in it. Enabled for chart types like Bar Chart, Doughnut Chart, Horizontal Bar Chart, Pie Chart, Polar Area Chart, and Stacked Bar Chart.
Download: Download a vizy as a CSV (comma-separated value) file, image, or PDF.
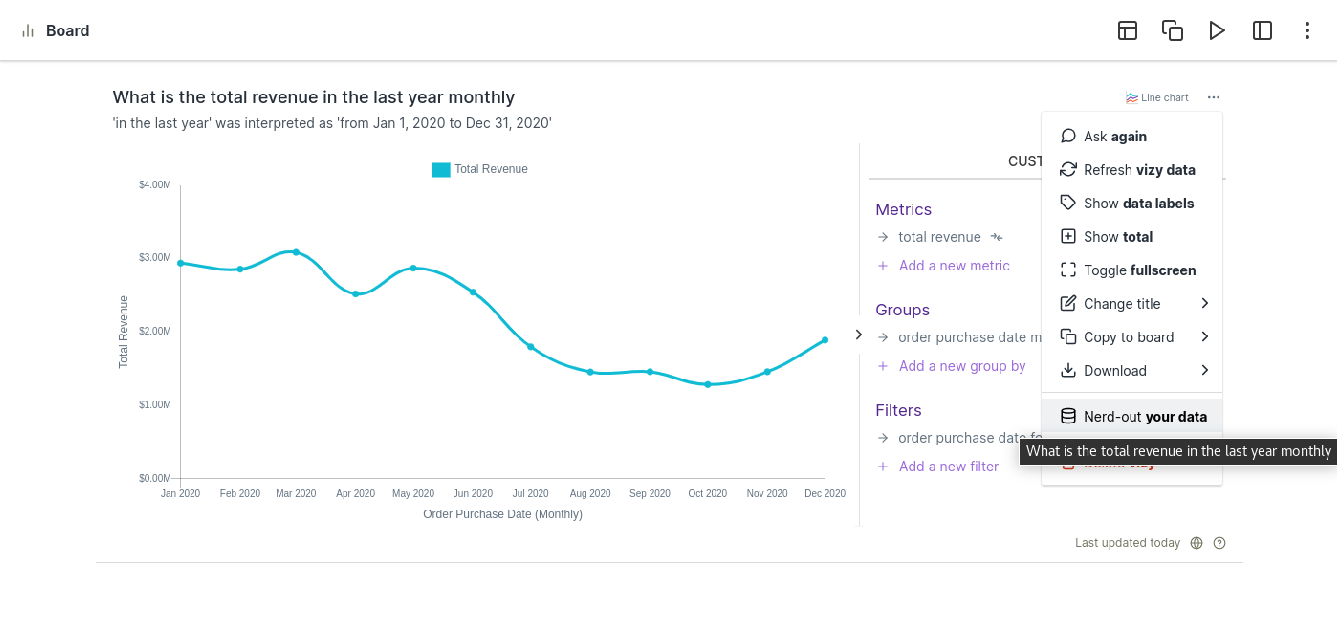
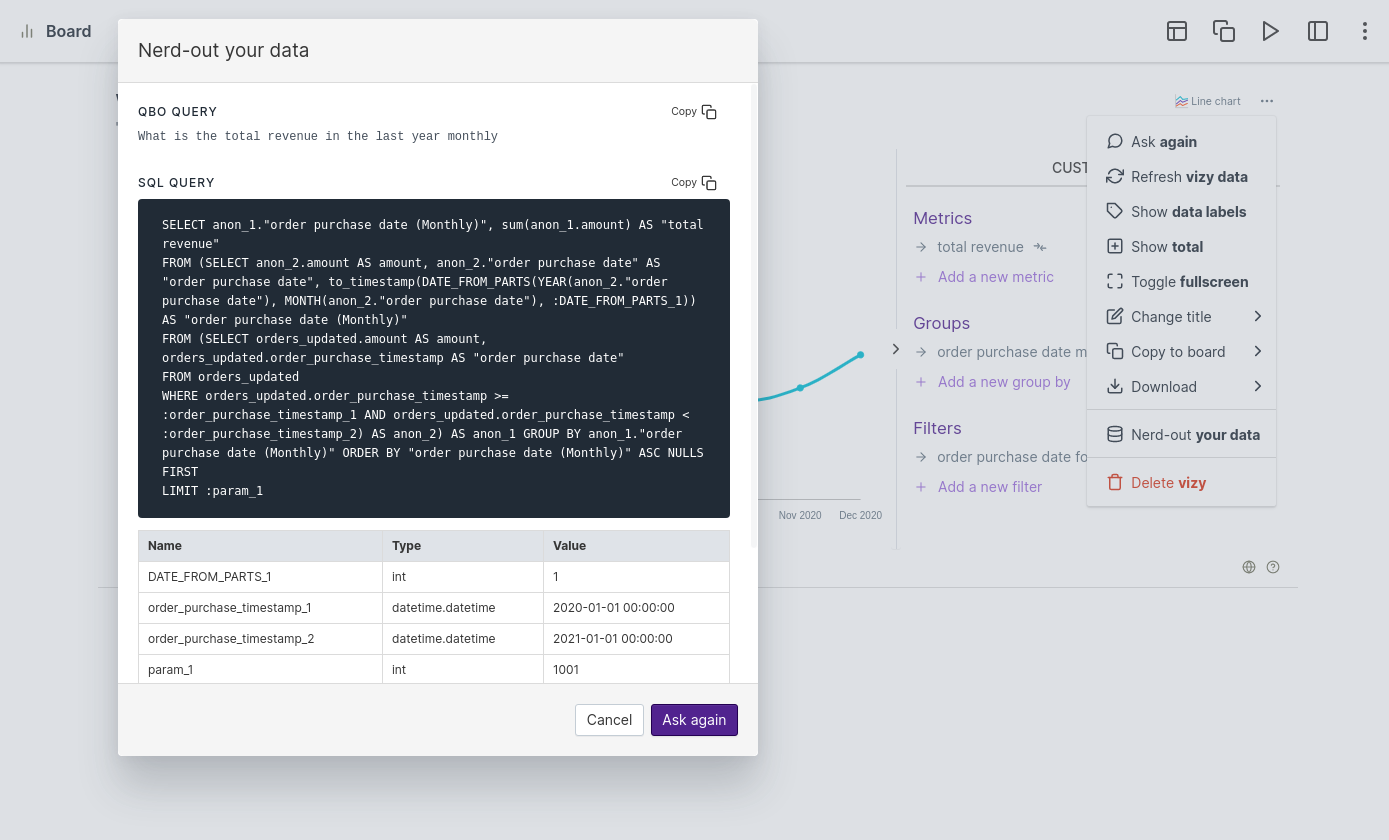
Nerd-out your data: See information about a vizy, including:
Vizy completion status: Displayed if the vizy has incomplete data.
Qbo query: Canonical query of the present response; either a base query or customized query.
SQL query: SQL generated by Qbo for the present response.
Metadata - QueryBot: Name of the bot.
Metadata - Executor: The configured data source.
Metadata - Entity: The entity from which the response was generated.
Metadata - Time zone: Established time zone for the product.
Metadata - Query tree: The base or original query before any customization.
Note
Verify your results by displaying the ‘internal query’ to show the SQL generated by Qbo to retrieve the results that you see on your screen. You can run this query on the data source to retrieve the values for the visualization.
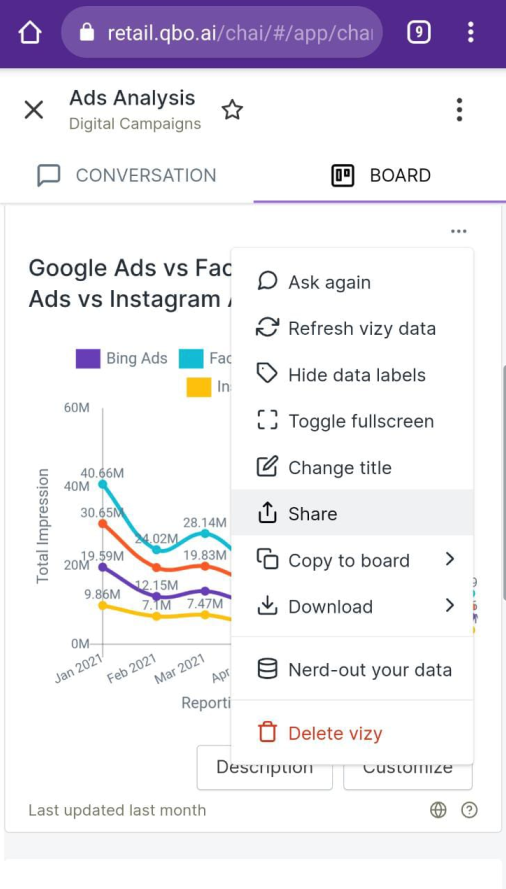
Share Vizy: This feature is only available on mobile. This is used to share a vizy on Whatsapp,Viber or Line app etc.
Delete Vizy: Permanently remove the vizy from the board.
Note
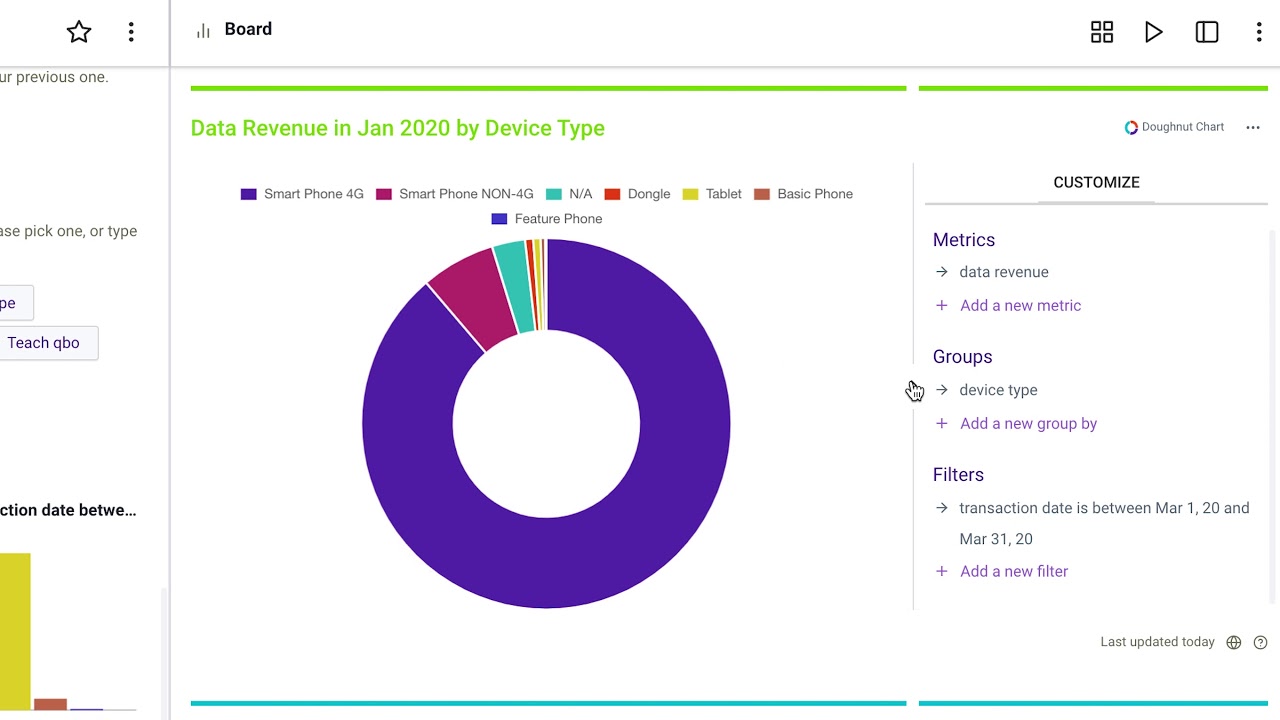
You can customize your results by adding additional metrics, changing the grouping of the variables and adding filters. These attributes have been picked up from the underlying data during the configuration of Qbo.
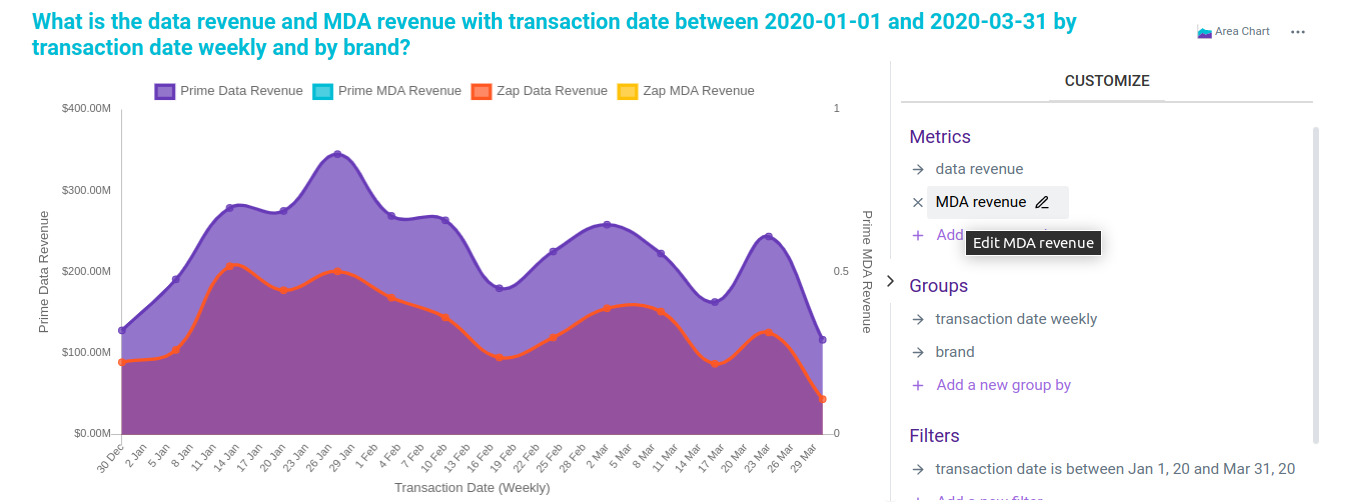
Related Videos
Customize charts on the fly with Qbo insights
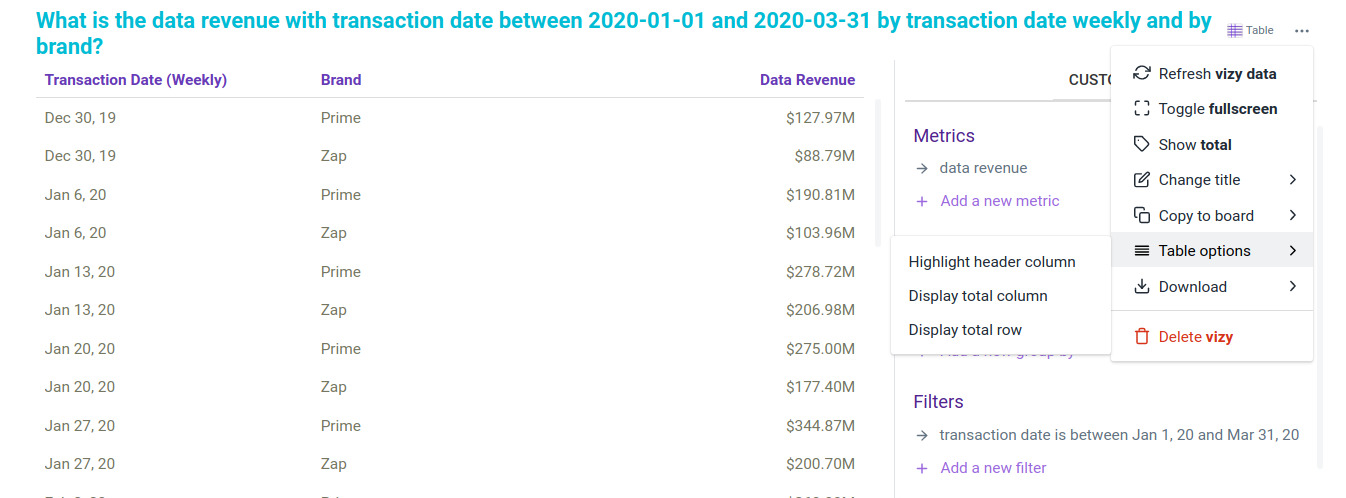
Table Options: Only available on table charts; display or hide rows and columns in the table.
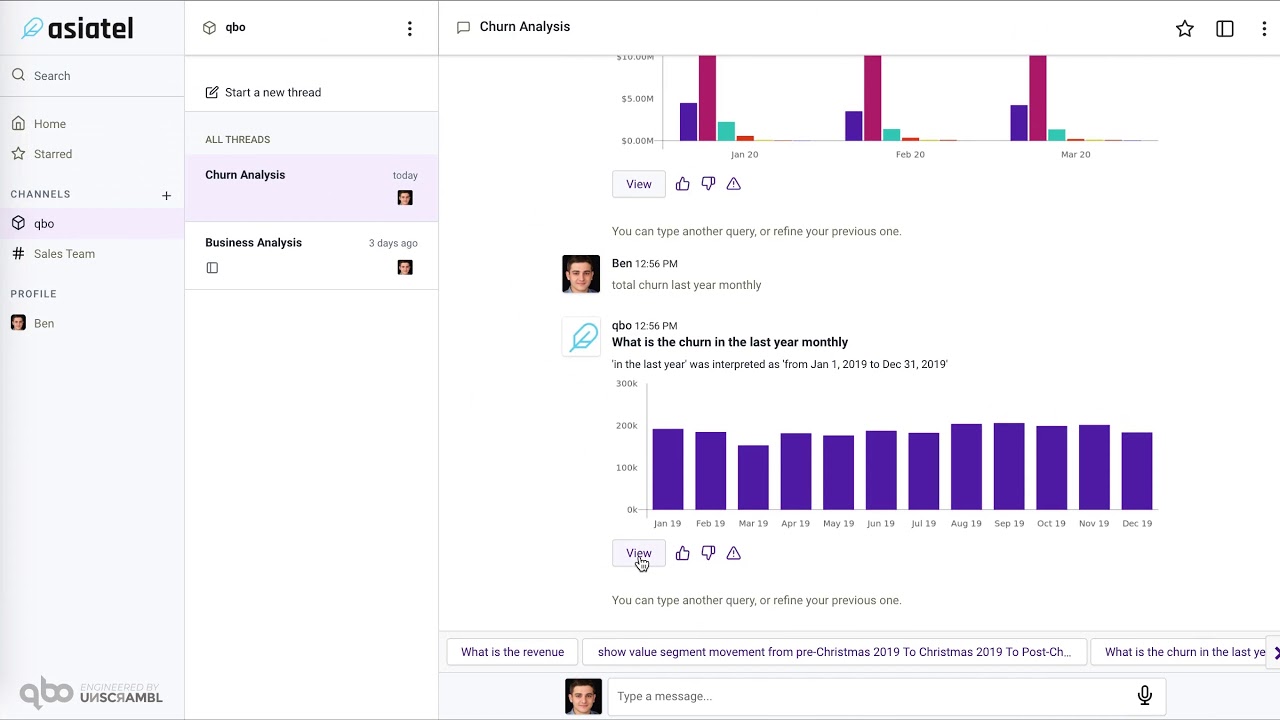
Ask again: Refresh the related query of the vizy and generate insights with current records in the data source.
You will see query results like:
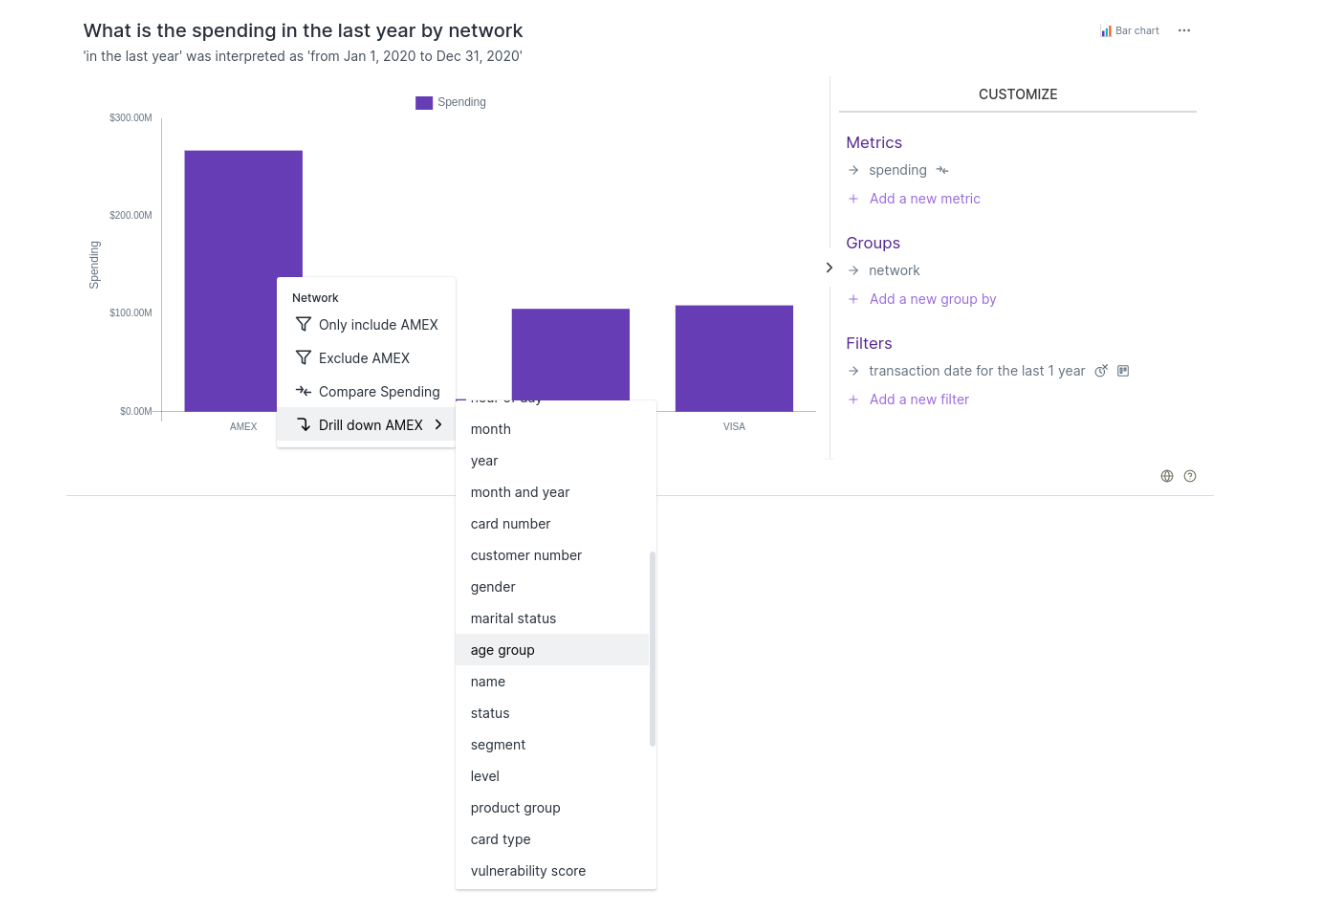
Drill down and compare from charts
You can refine the existing vizy output using drill downs. To drill down, right-click on the vizy and select an option.
For example, this vizy shows the spending analysis of different card networks:
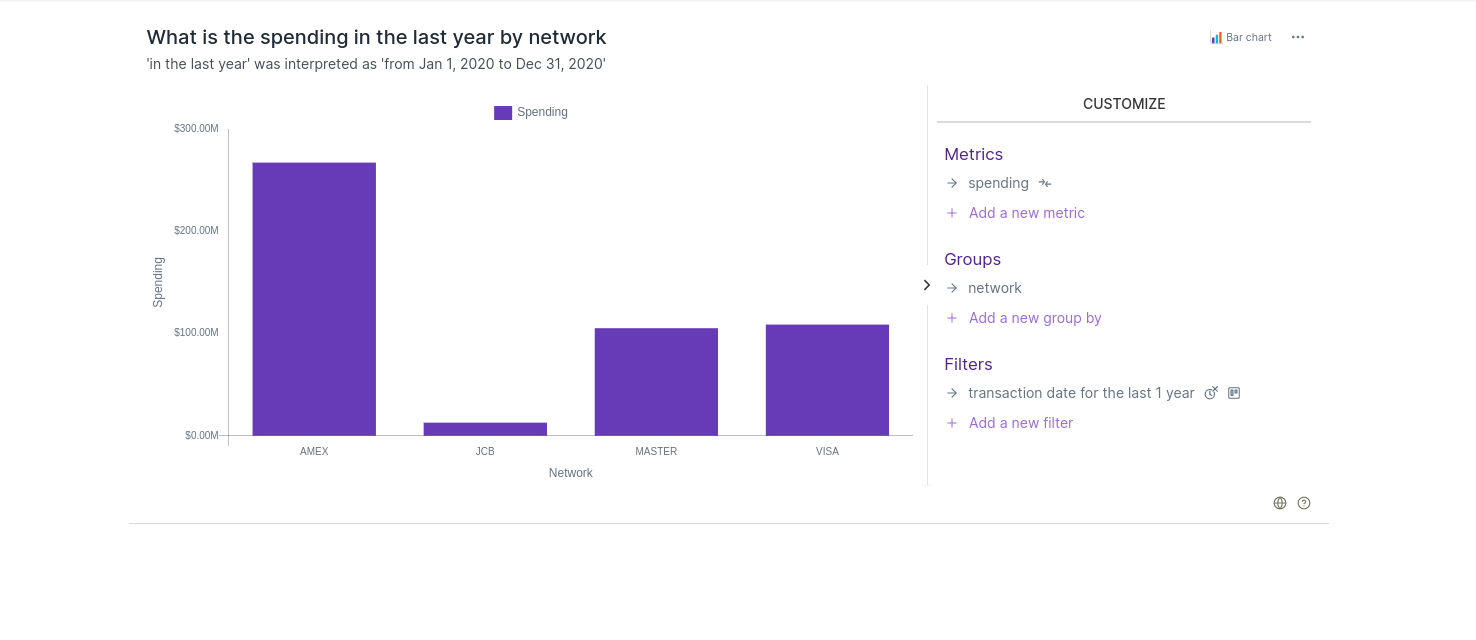
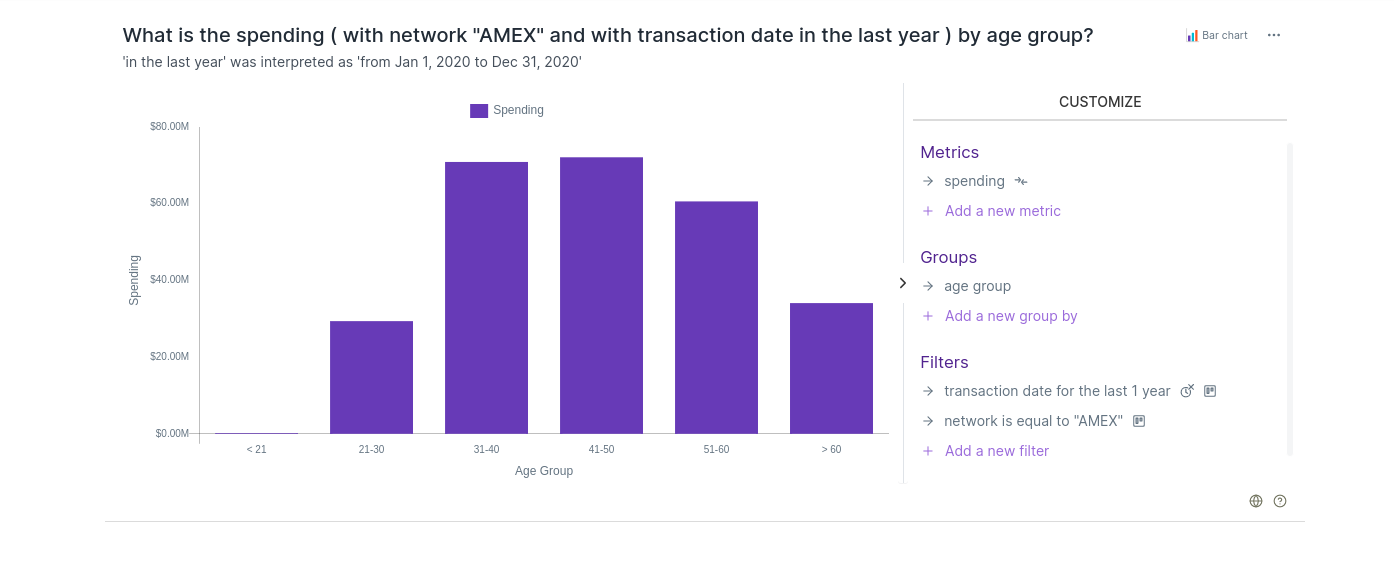
To analyse AMEX card spending by age group of users, right-click the AMEX bar, click Drill down AMEX, and select an age group.
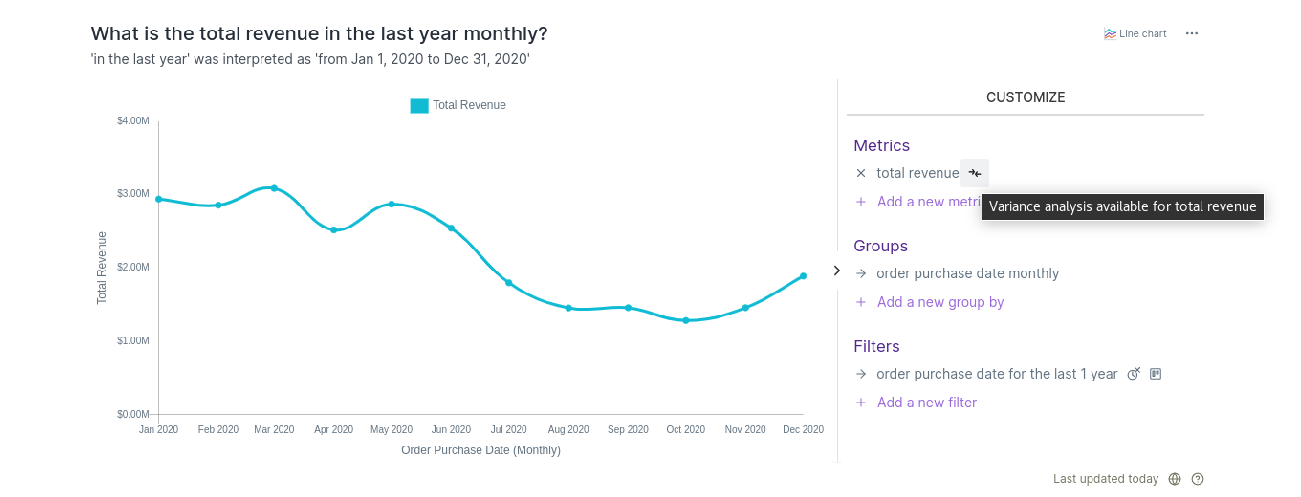
 Compare icon: Configure and run variance analysis for the corresponding metric.
Attention
The compare icon will only be visible when the metric (aggregate) has been set up in the variance analysis configuration.
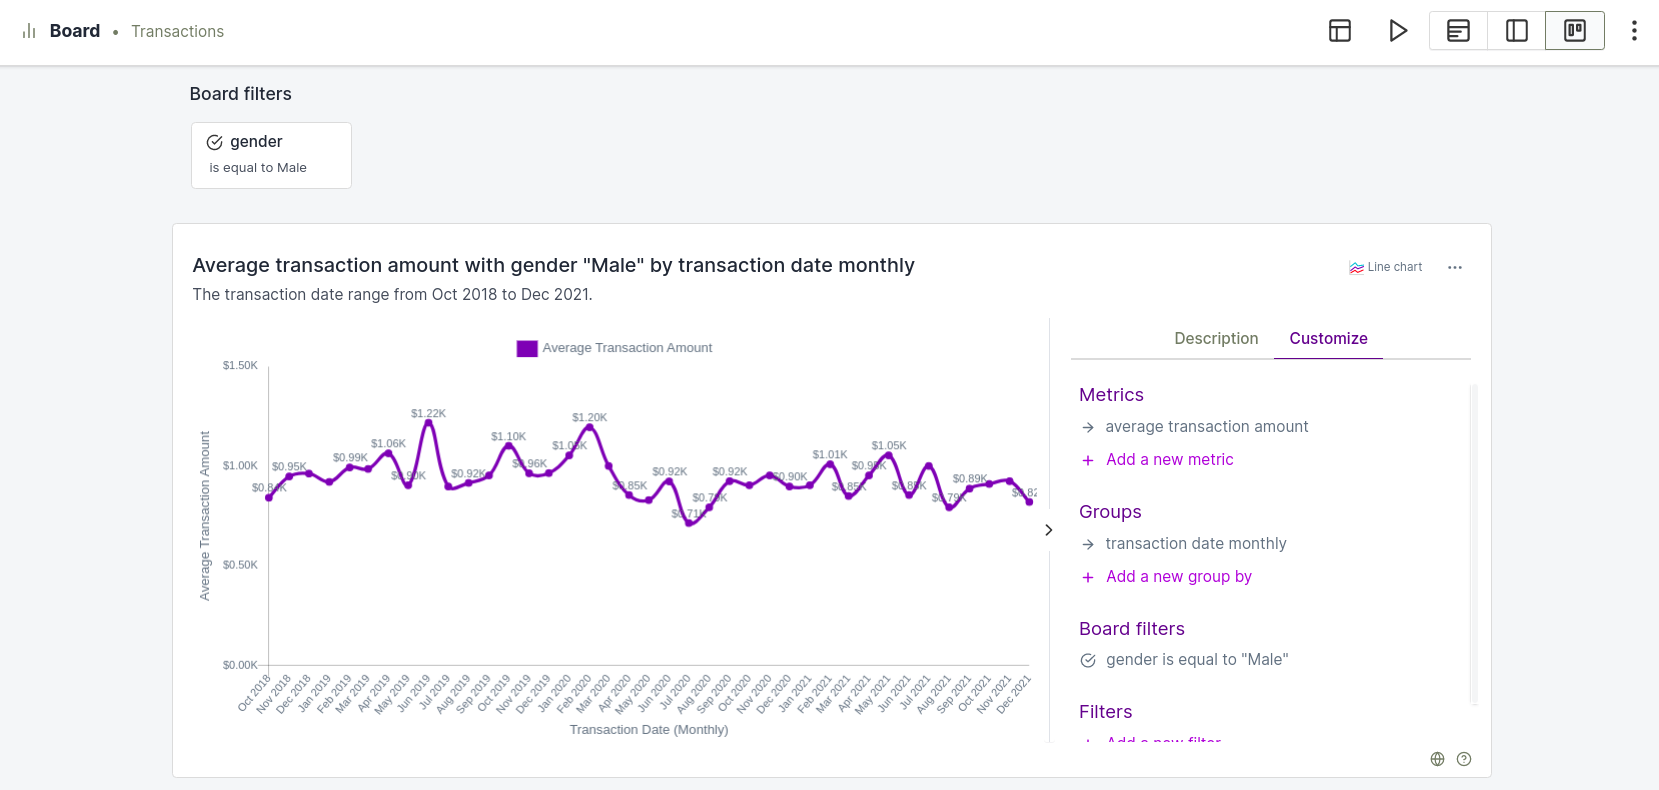
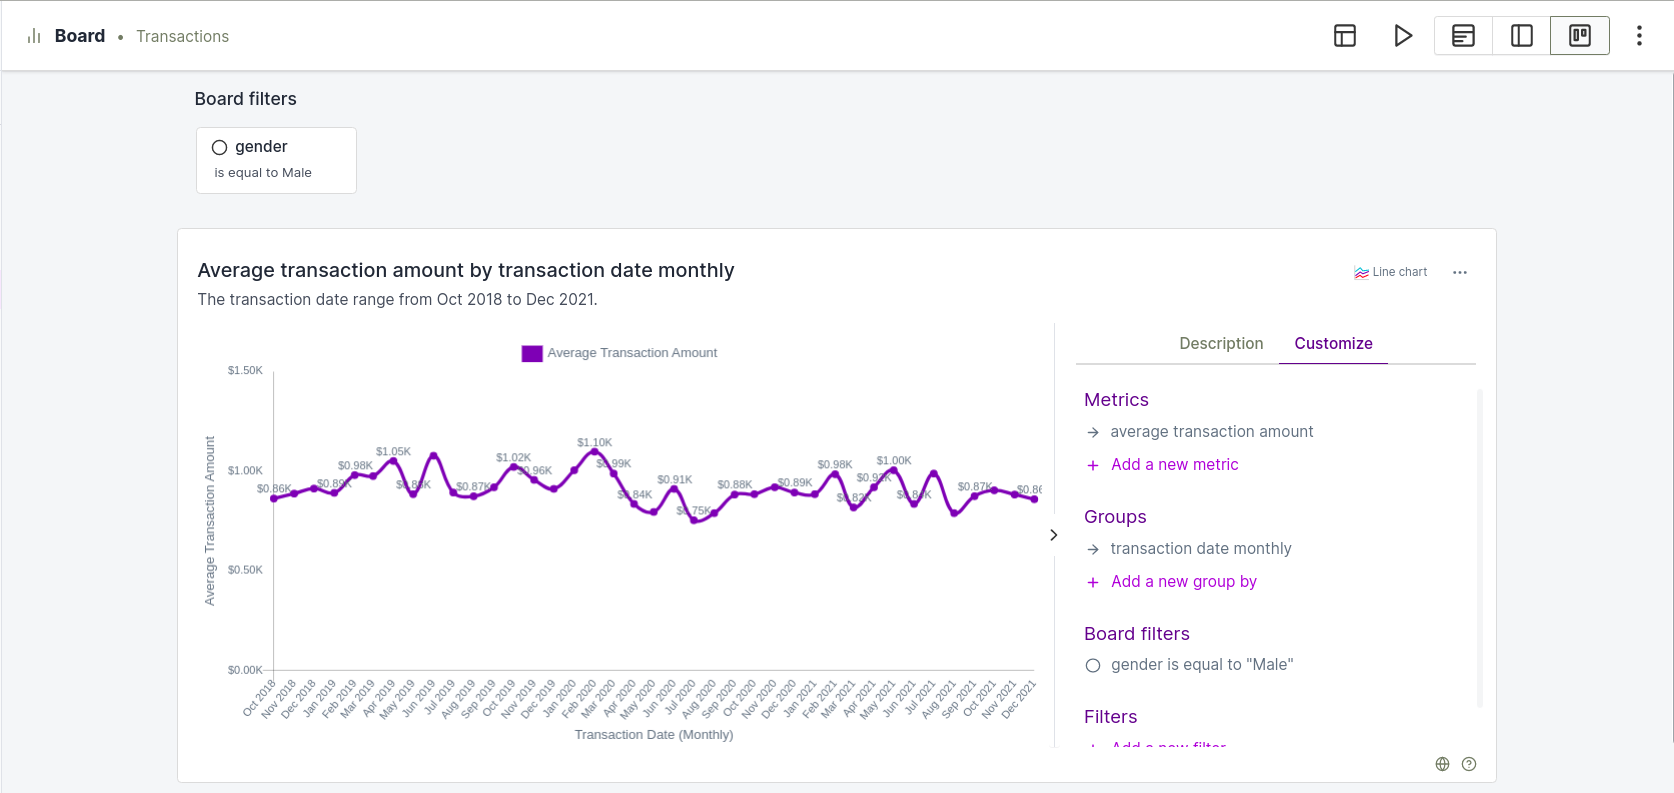
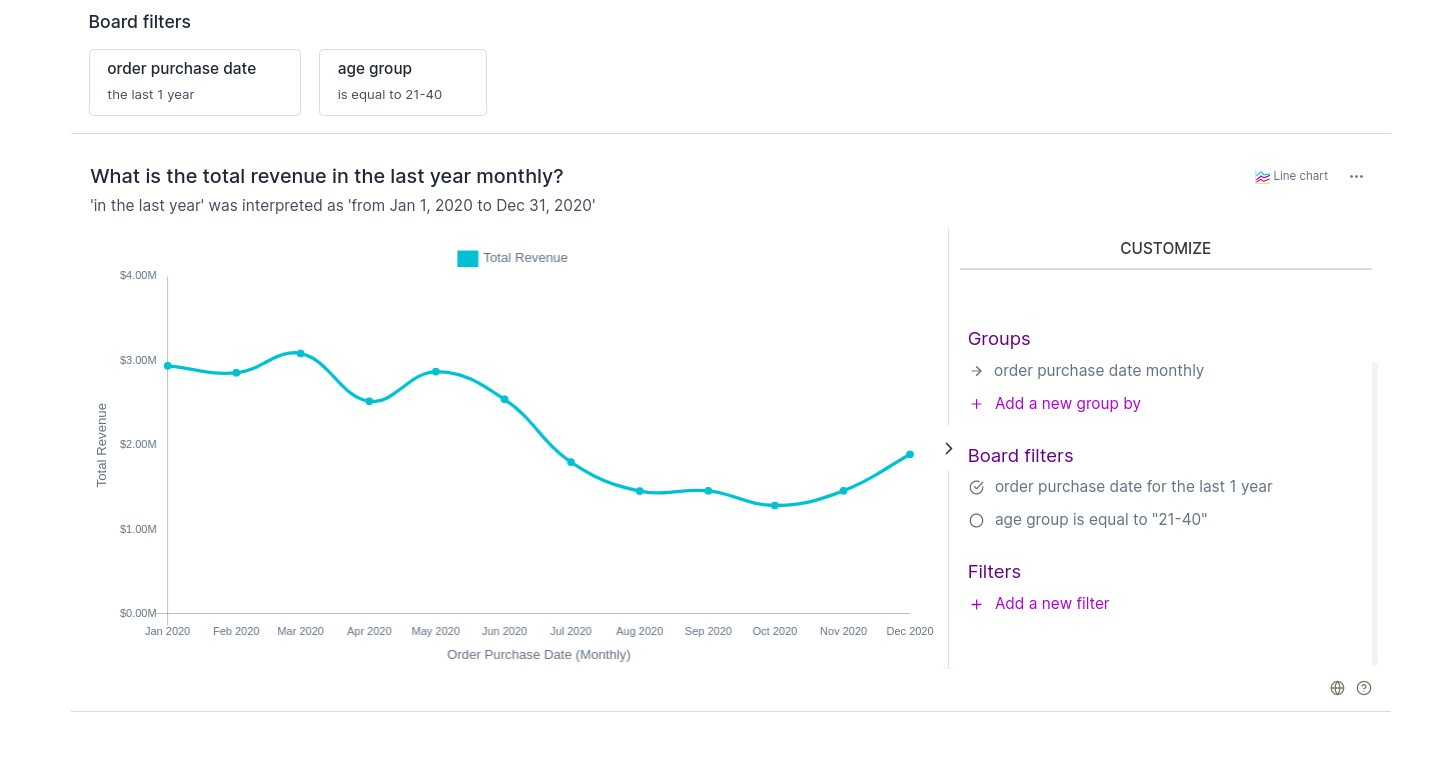
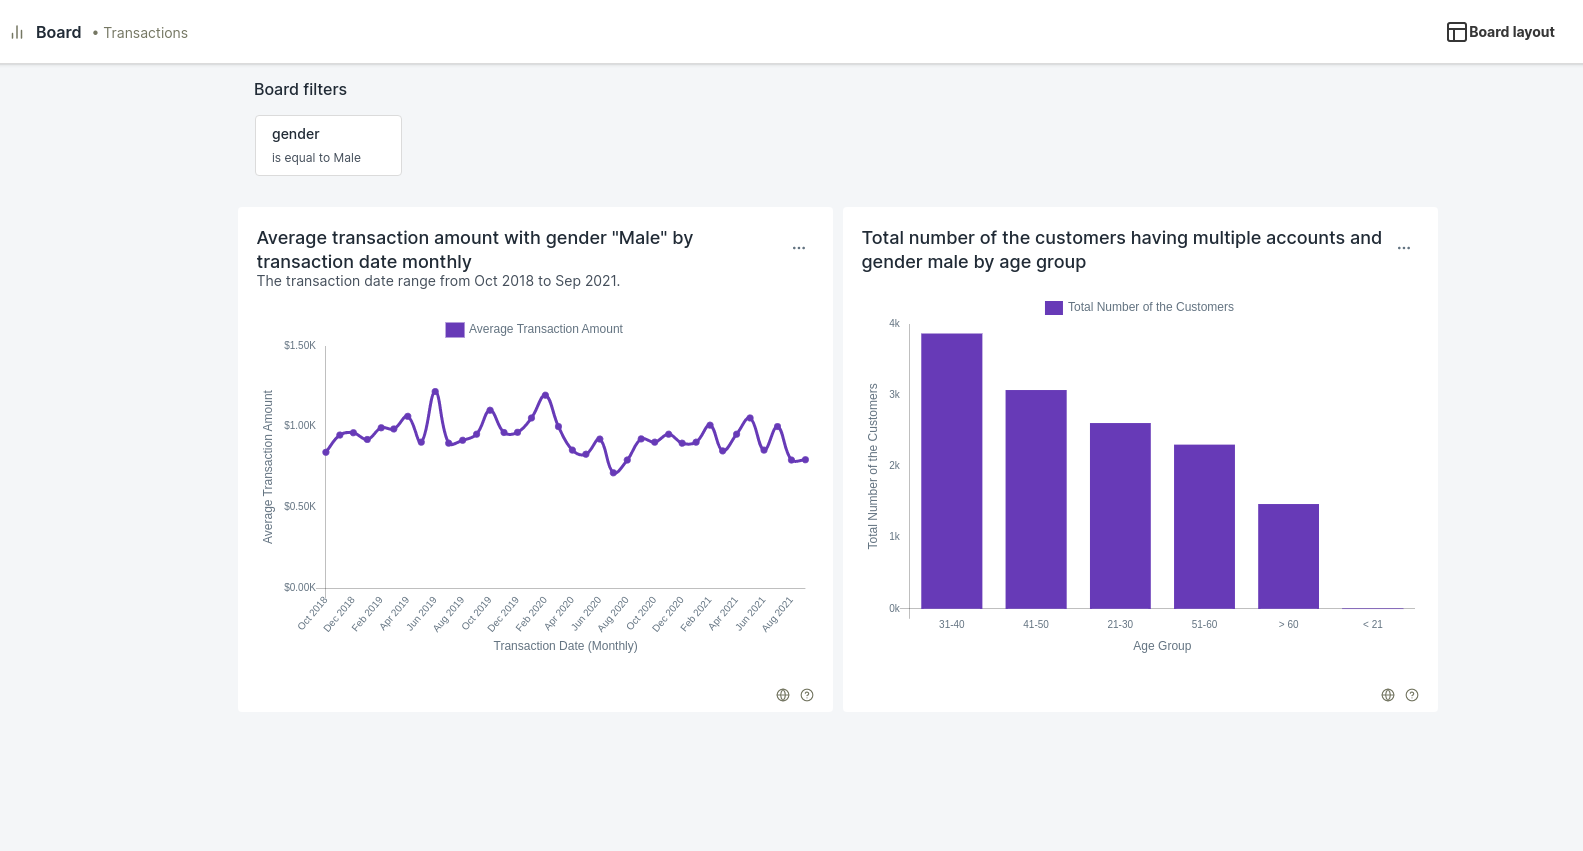
Board filters
You can filter all vizies on a board using a board filter. Find available board filters in the listed at the top of the board.
You can enable or disable a board filter for a specific vizy.
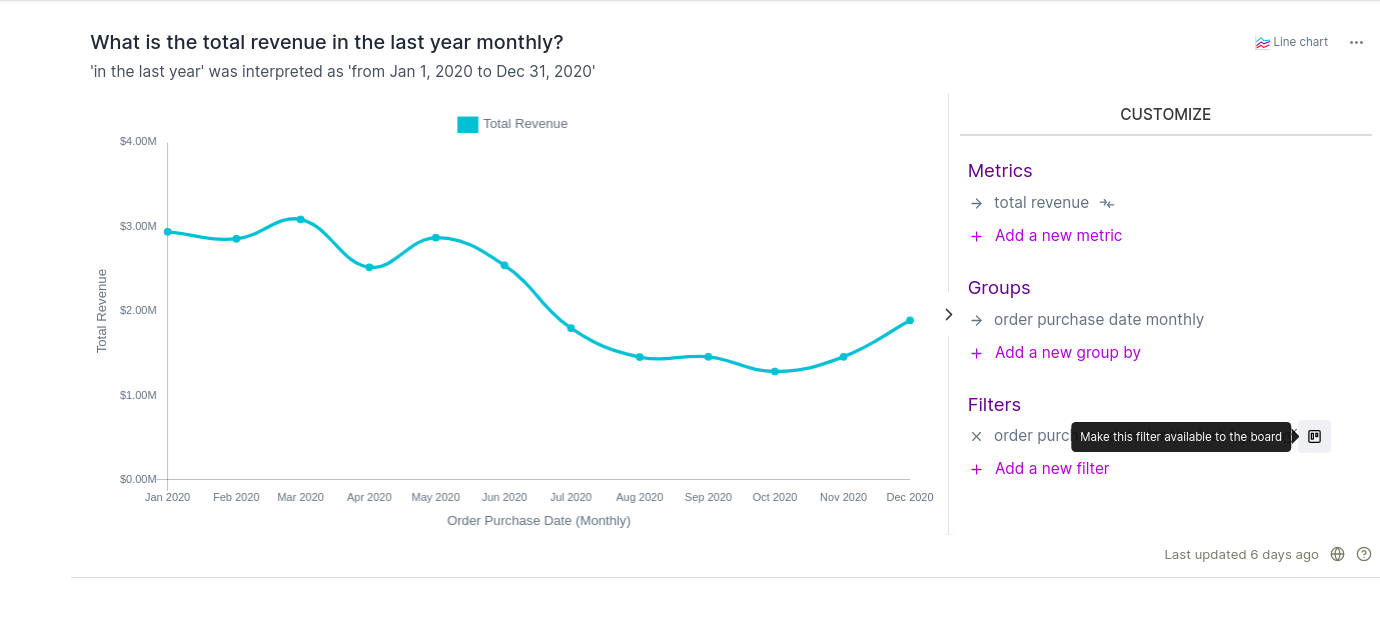
To convert a vizy filter to a board filter, click the board icon next to it.
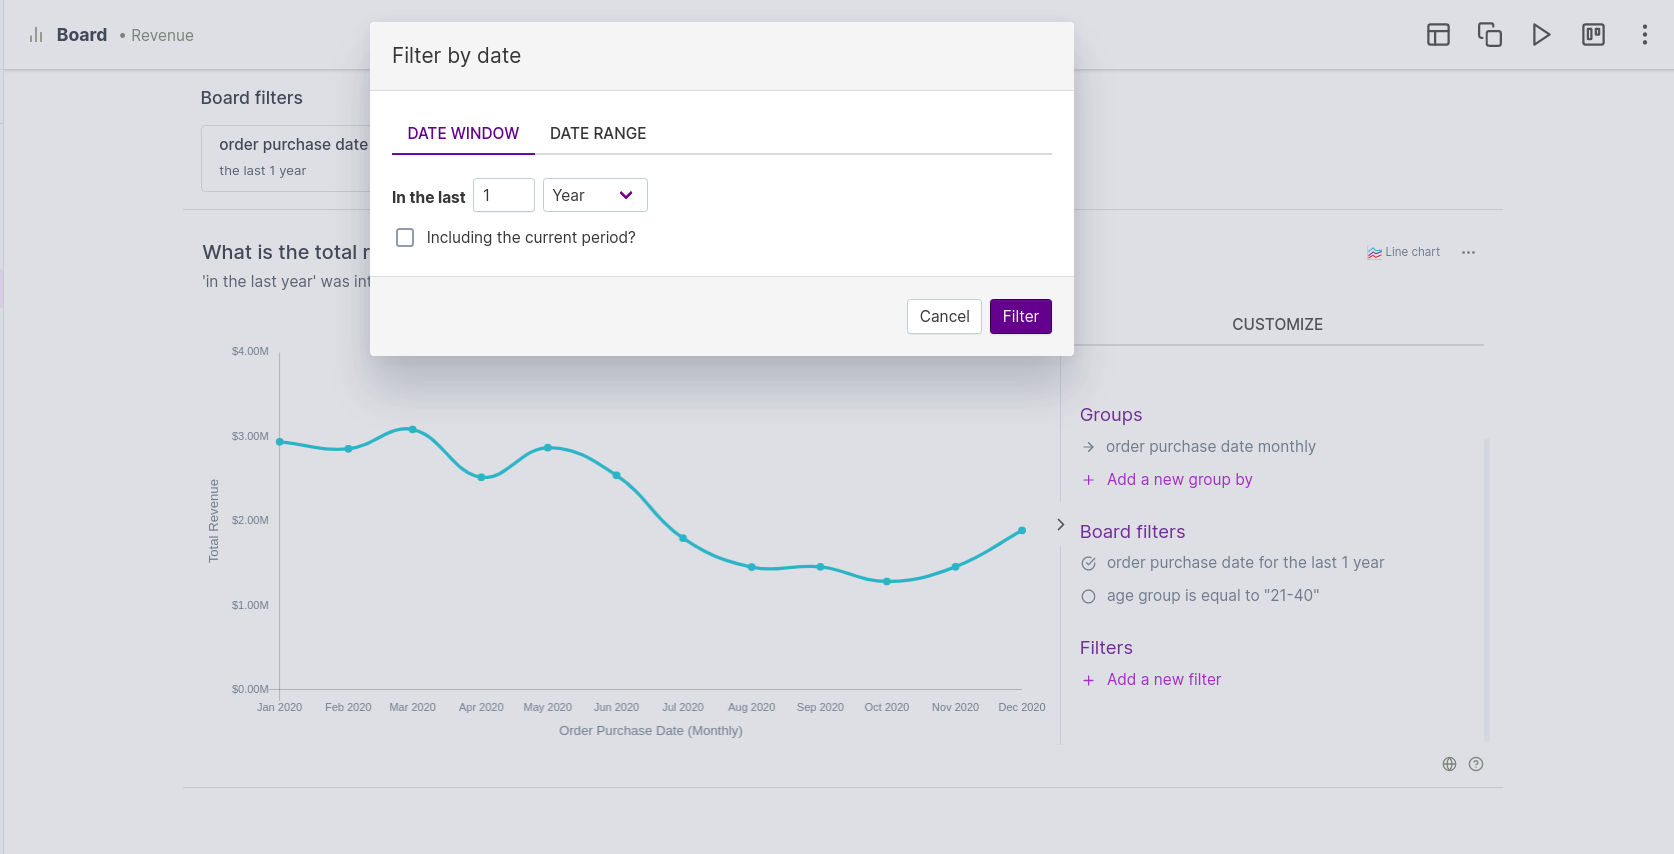
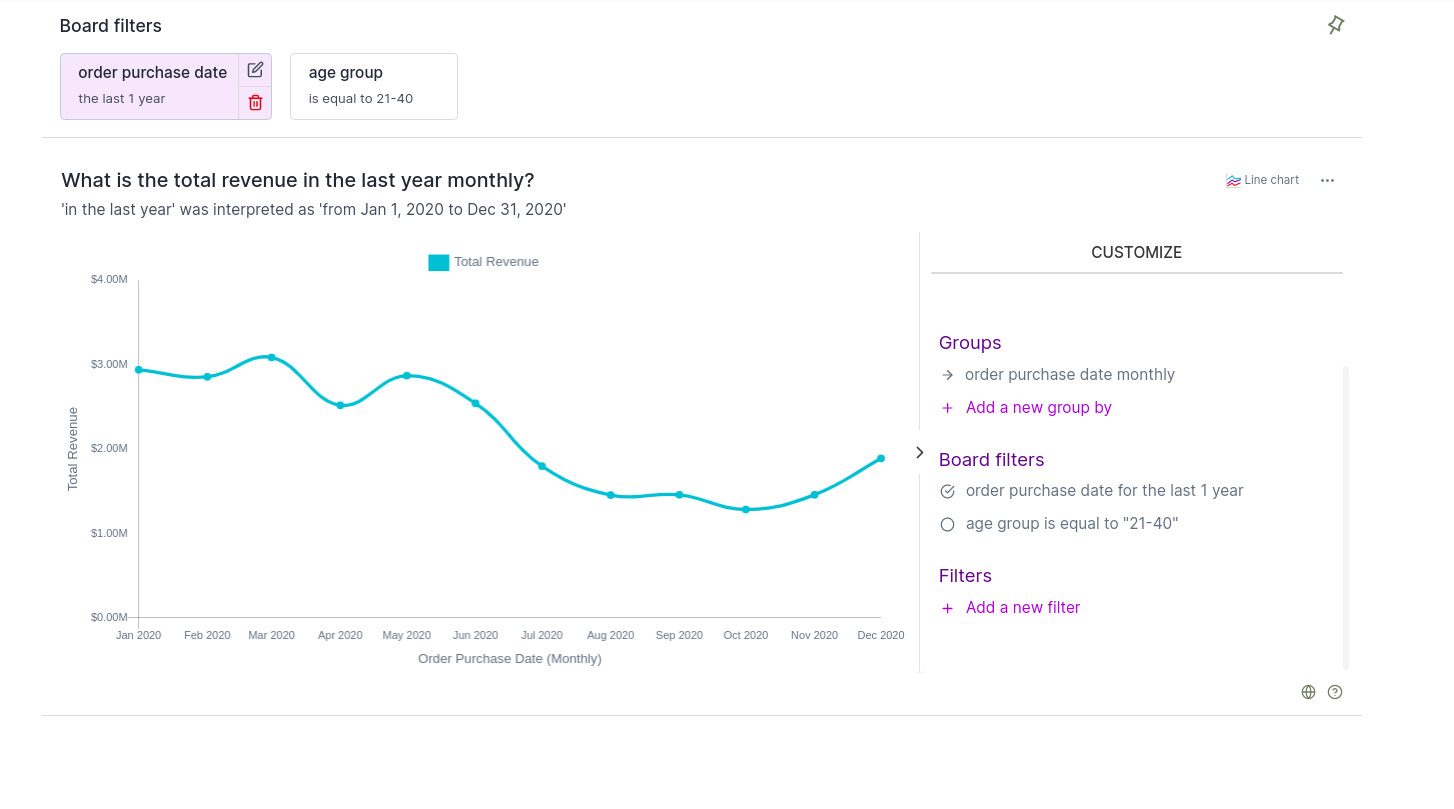
Edit and remove board filters
You can edit or remove board filters. When you update the value of a board filter, it affects all the vizies in the board that uses it.
Combine board filters
You can combine multiple board filters on the same attributes of different entities to form a single board filter on that attribute.
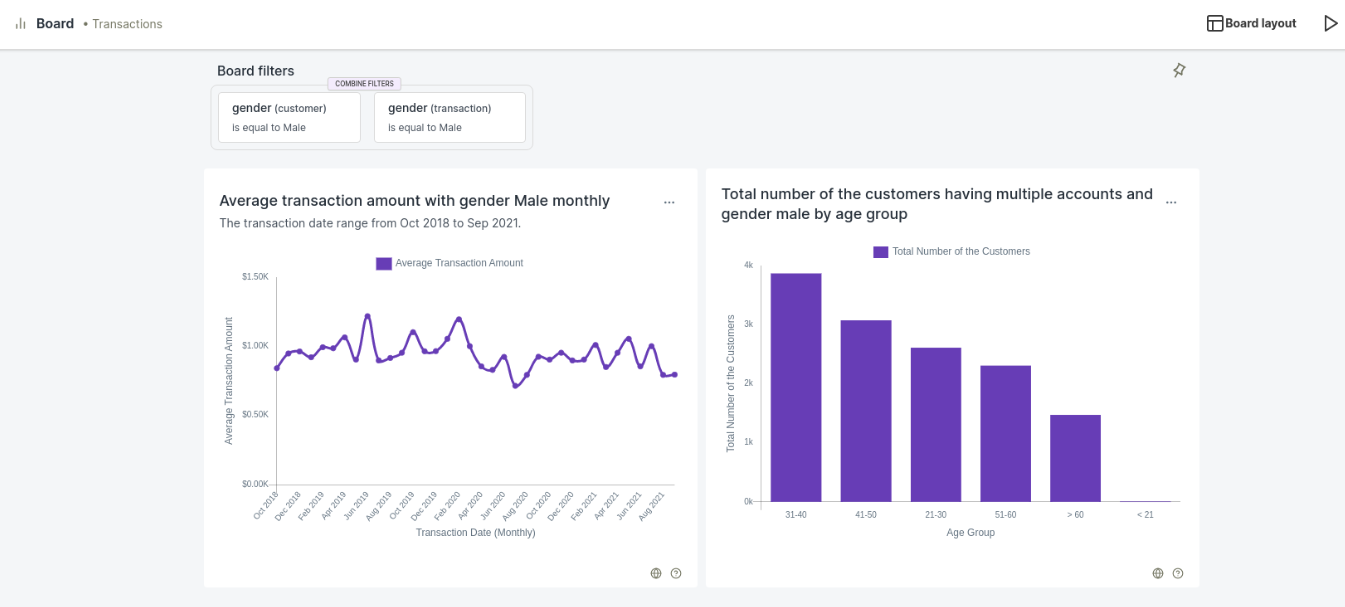
Hold the mouse pointer over a board filter. If attributes of different entities match, you’ll see a Combine Filters option.
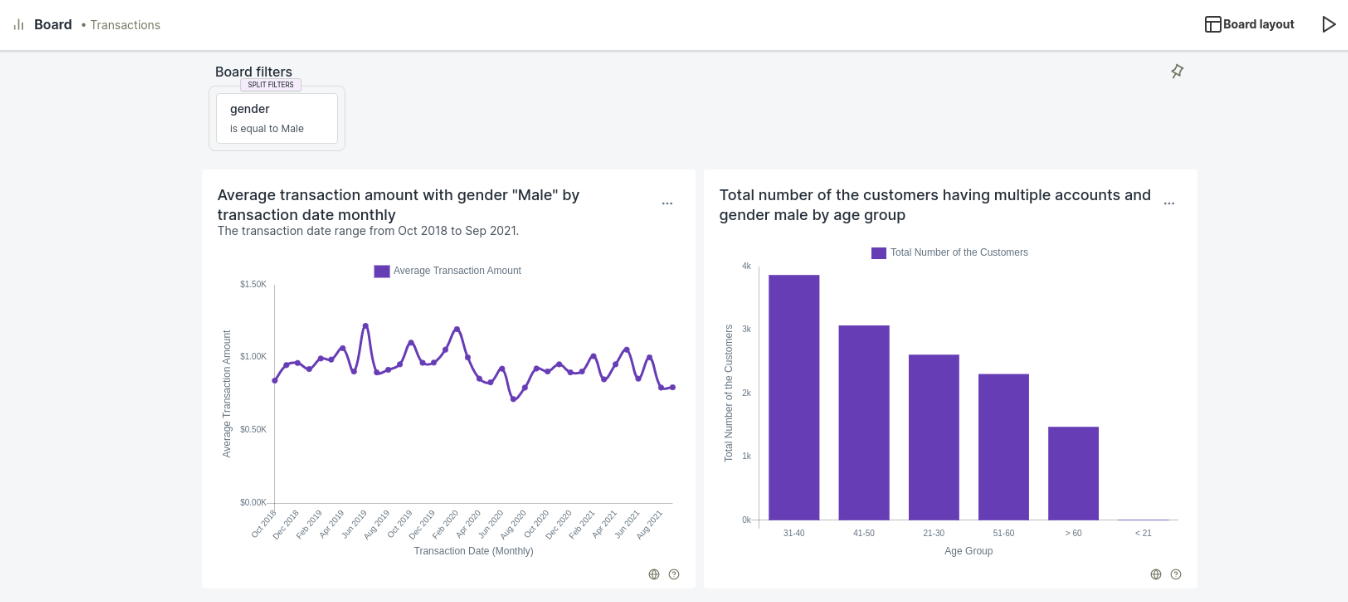
Split filters
You can separate combined board filters into separate entity level board filters.
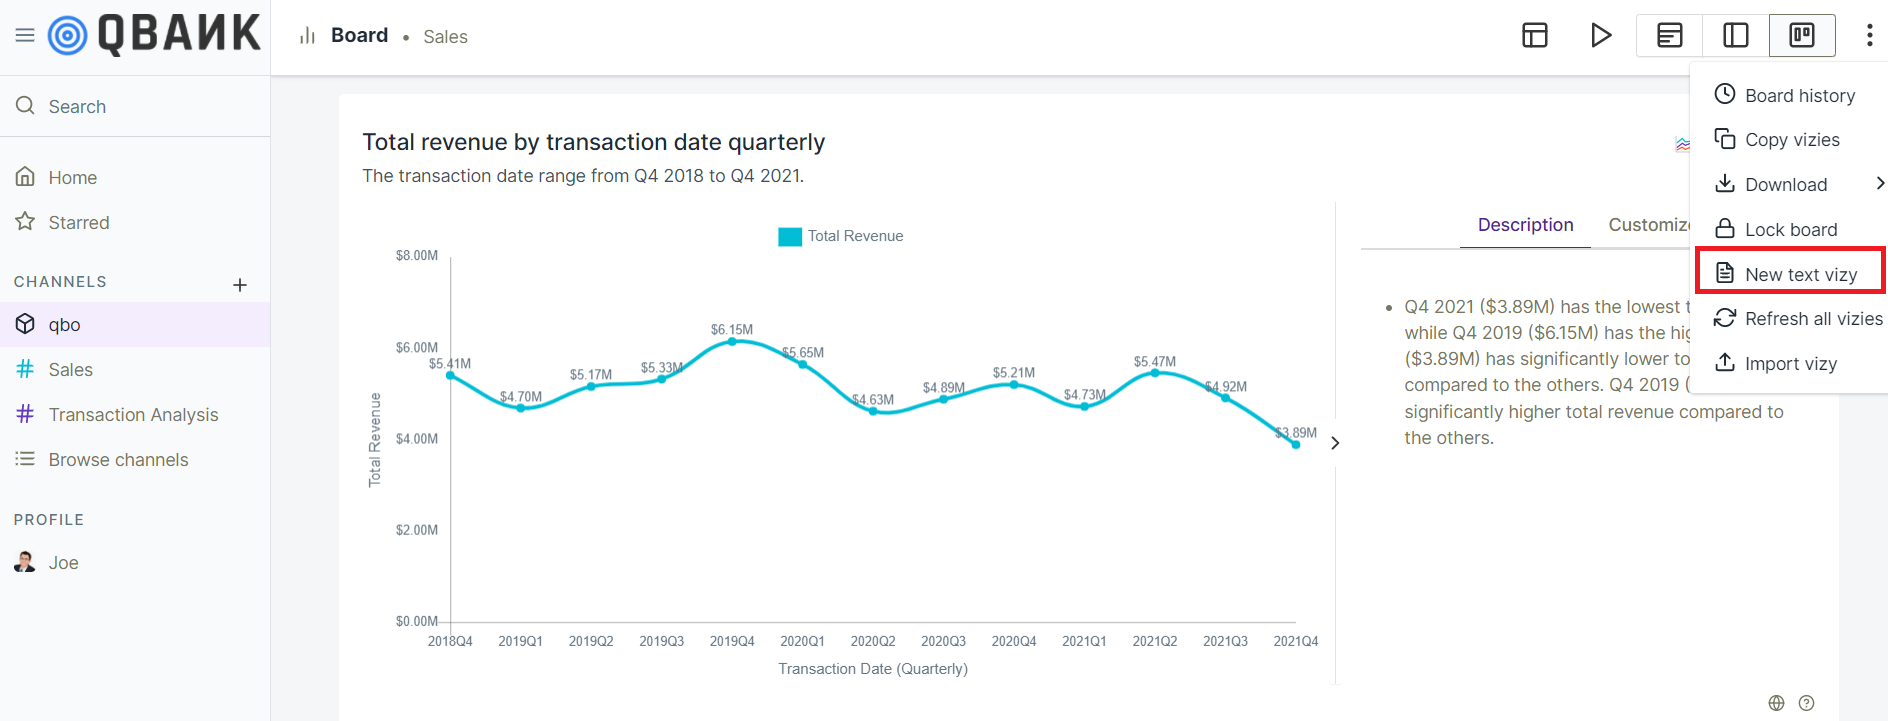
New text vizy
It will allow you to create vizy for required business KPI manually. You can calculate business KPI results in your existing application and prepare vizy in board. It will be useful for representation of key business metrics.
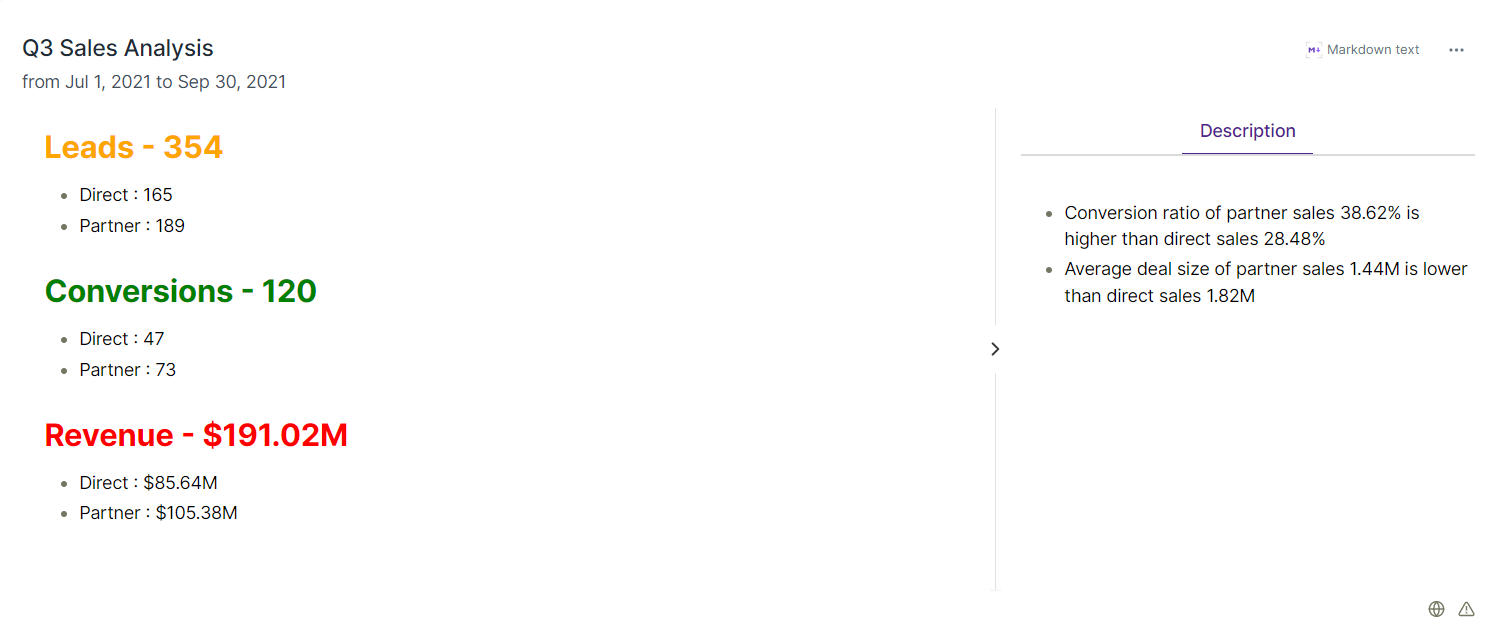
For example, you have to analyse total sale in the 3rd quarter of year 2021 which includes Number of leads, conversions and revenue . You can find sales details in the existing application or calculate it manually. Now prepare vizy with required sales details in the board.
Steps to prepare New text vizy are as follows,
1. Go to board section and click on three dots present on right corner of the board. Now select New text vizy option
highlighted in section given below,
Fill the required vizy components are as follows,
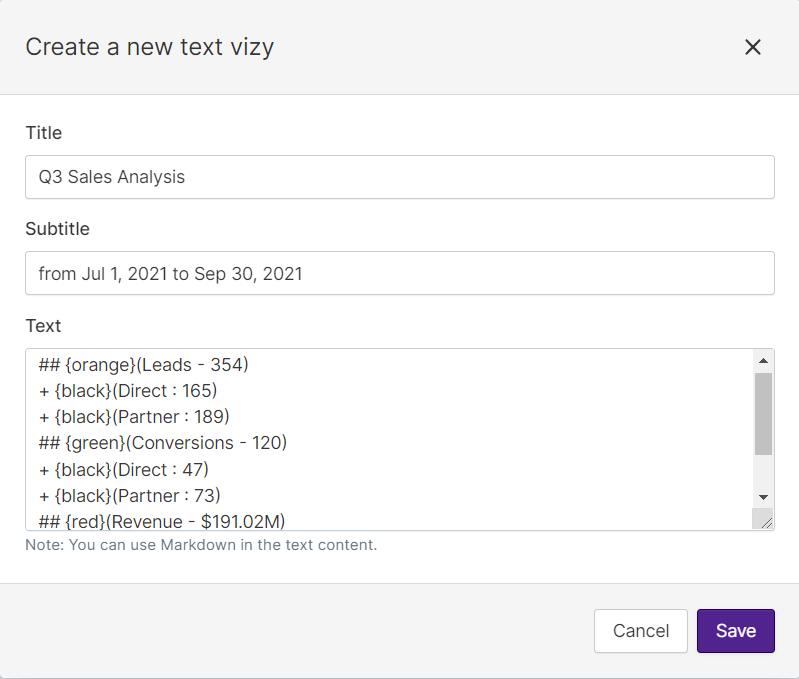
Title :Enter the title of required business KPI. This field is mandatory.
Subtitle :Enter sub title which describes the title. This field is optional.
Text :Enter the result of business KPI. This field is mandatory.
3. After filling above details click on save button to complete the vizy. Vizy will be created in board as follows,
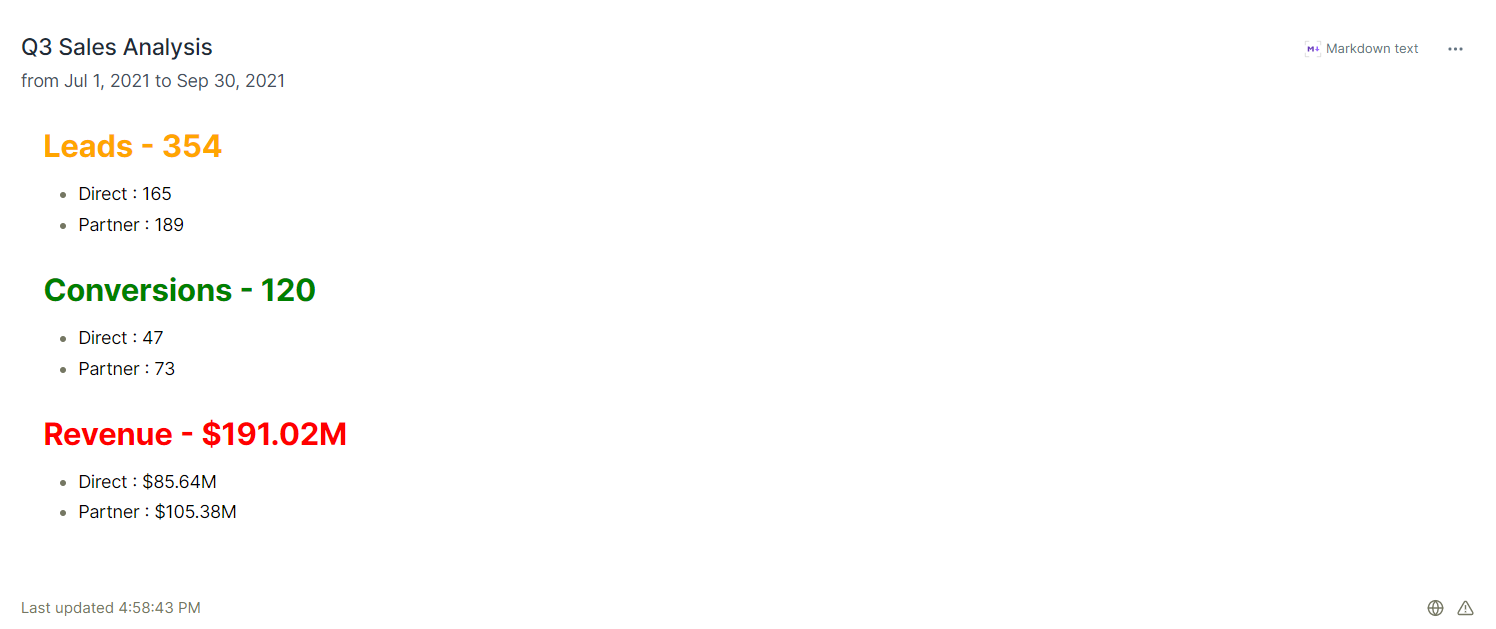
Further you can add some description to the vizy. Description will allow you to add some key notes for the vizy. For example, you can compare direct and partner sale along with business KPIs leads, conversation, revenue and determine their performance.
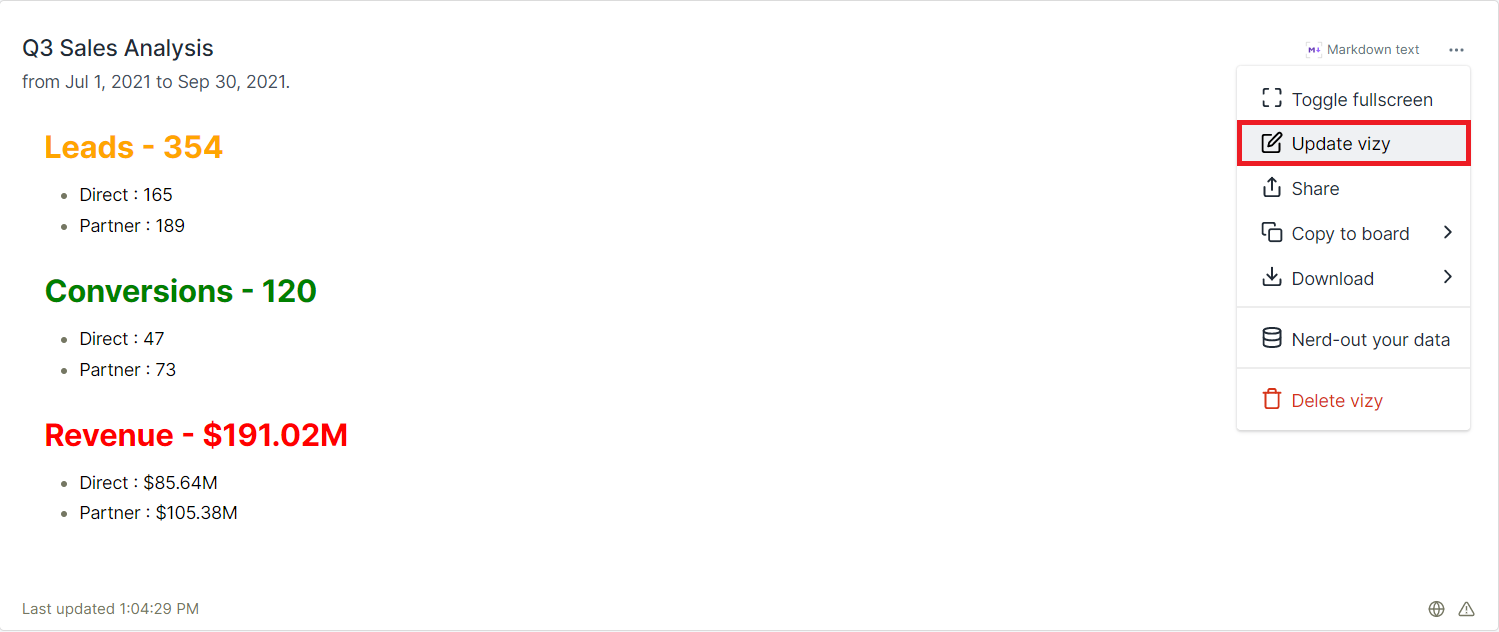
You can add description as follows,
Navigate to update vizy section
Add key notes in description section
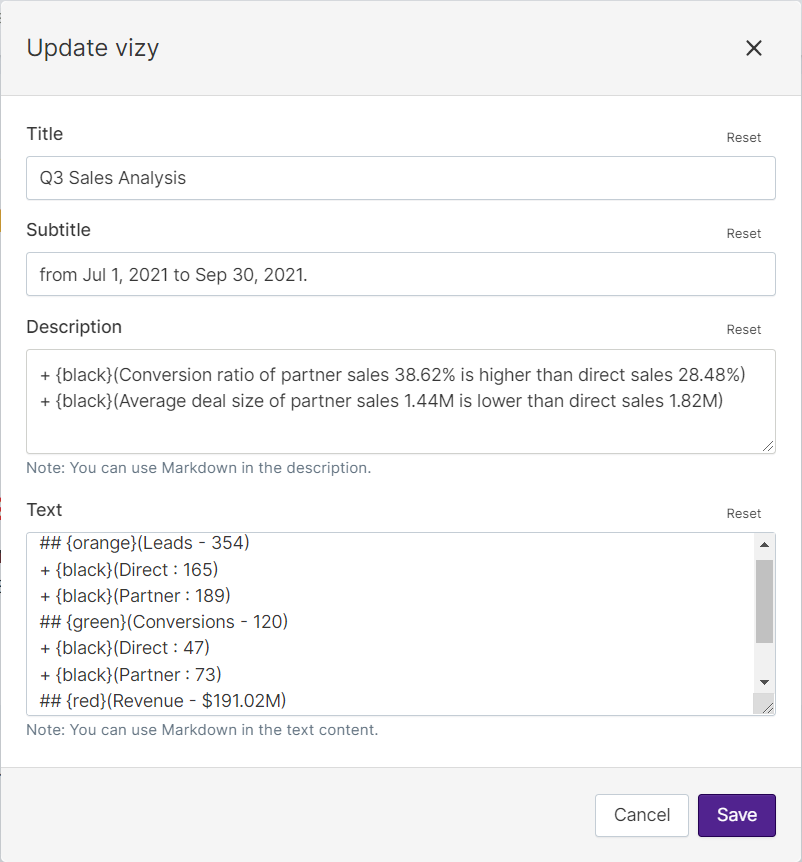
Click on save button to complete the vizy changes. Vizy will be updated as follows,