Vizies and Boards
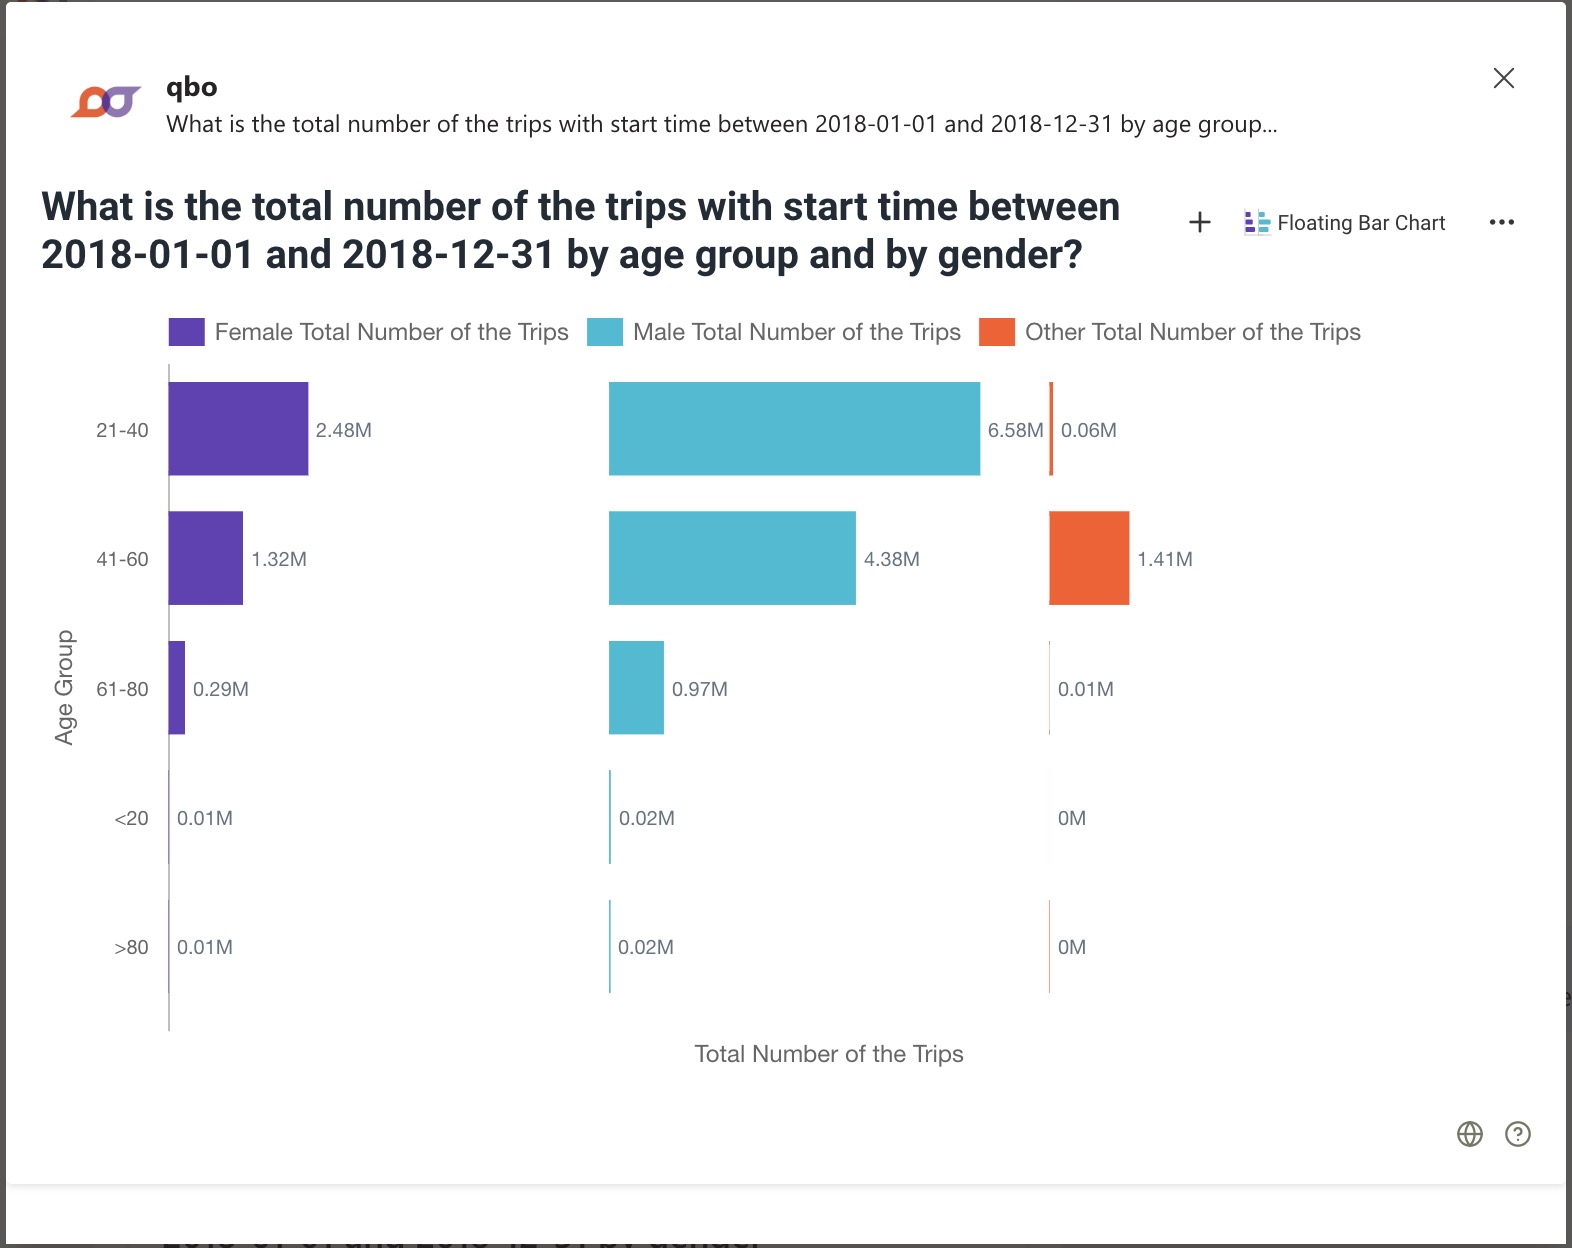
Qbo offers a range of data visualization options to assist you in interpreting the results you receive. It will automatically assign the chart type best suited to the data it displays. For example, insights with geographical dimensions are displayed on a map, but daily revenue trends use a line graph. This allows even non-technical users to represent findings clearly and attractively.
Vizies
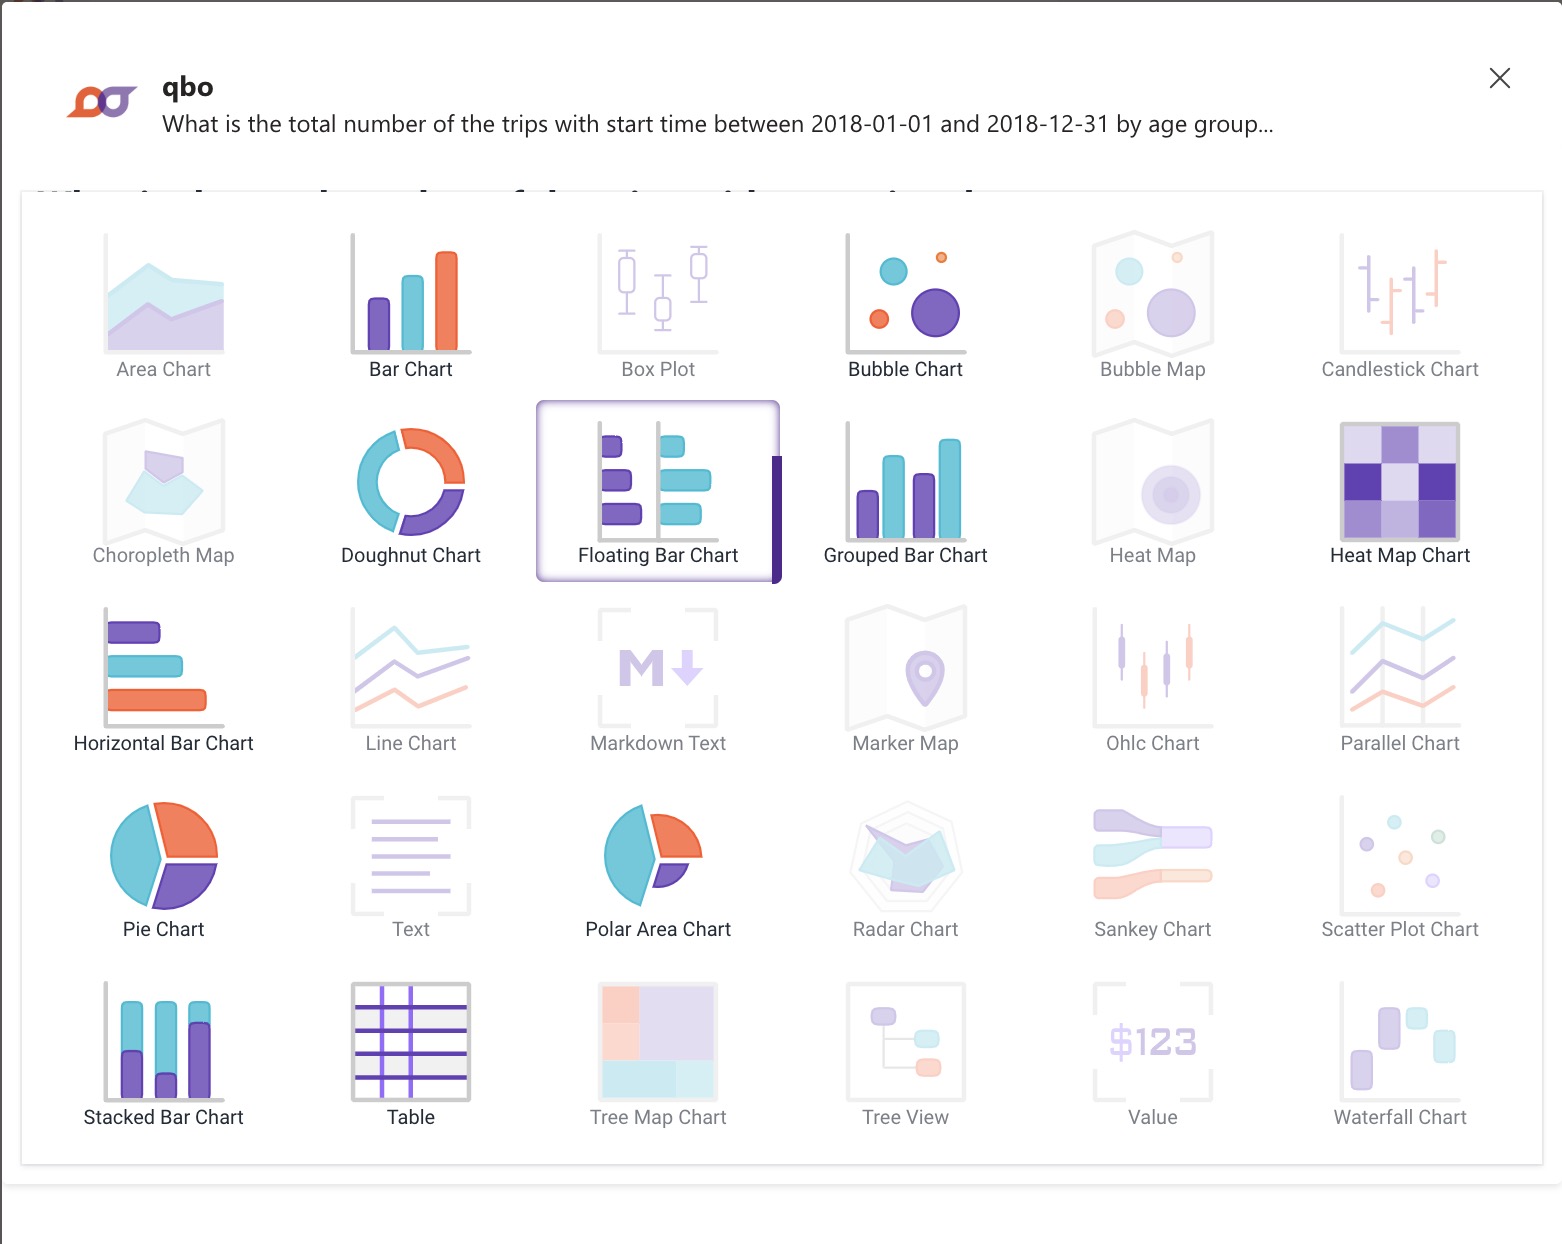
There are over 30 chart type options to select from. Not all will be available for every vizy; Qbo curates the list of chart types to suit the output of your question.
Click the chart icon to explore other chart types available for the vizy.
Check the bar next to a chart type to see how well Qbo thinks the chart type matches your data.
Boards
A board is a collection of vizies, and is associated with a chat with Qbo in personal scope, a channel or a group. You can:
Customize the order and size of the vizies displayed on a board.
Display a board in presentation mode, where each vizy is displayed as a slide in a slide show.
Edit the title of a vizy.
Customize a vizy with additional metrics, group-by attributes, and filters.
Once you have your board looking the way you want, you can refresh all vizies at once, download the board as a PDF, or schedule a report for Qbo to send at a preset time to a set of recipients.
See the Qbo user guide for more information about boards.